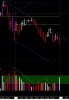
Close-up snip of yesterday's up container breakout and todays session with new down container. 2/21/18-2/22/18
The chart has been (correctly) updated.
The blue dashed line is the RTL of the sell-off container, which now has pt1, pt2,and pt3.
What is next? Did it occur today? The rectangle in the volume pane is Band A... perhaps provides a clue.
As reminder, it is a 15min NQ, RTH only, I use as reference.
This is what I see. Since you've mentioned the A band, I'll comment from the RDBMS perspective.
Seeing the context of the prior bars might change the the following.
Bar11:00 is an OB. Depending on where it is in the OOE a PP4 or PP5. The following bar is an assigned P1. The following bar is a T1 so it sets the RTL. This bar is also the FTT of the prior long trading fractal.
The first A band is set by the above two bars. It's a smaller zone than what you have defined.
Bar11:45 is a P2. The following bar is an EE - Ag hvbo. This bar is assigned P1. The RTL is accelerated. A BM is placed at the low.
Next bar is IB so wait but is could be a BO of this accelerated short tape to the long.
Following bar does not have followup volume for the long it reverses and breaks the RTL long of the prior two bars. It is an OB but not an EE since the volume is decreasing so T1. The RTL short from bar11:45 gets fanned.
The last bar of 2-21 is a P2.
The next bar is confusing at first because it is not degapped on the chart. Mentally degapping the bar makes the opening bar of 2-22 geometrically within the carryover short. If the carryover wasn't done then it looks like a bull bar and a BO,T1.
Lets say the carryover was done, then this volume bar is a T2P and the following a T2F. This T2F < T1 so it's an EE - Fd lvbo.
Being an Fd makes the next bar an assigned P1 which would be the low of the day up to that point. This bar and the one before make a StR. StR, StB and OB frequently are around points of change.
Bar7:15 is a T1 and sets the RTL for the non-Dom traverse.
A Lateral is established at bar7:45 and although the fourth bar of the lateral extends past the lateral boundary the lateral is still in effect since there are not two closes outside it.
Bar9:30 is a P1.
Bar9:45 and Bar10:00 set up the next A band.
Bar10:15 is a P2, the following a T2P.
Bar10:45 is a T2P > a P2 which makes it a Bc EE. The next bar is an assigned P1. This sets the RTL for the non-Dom traverse. It's non-Dom since volume is decreasing.
Bar11:45 is a BO,T1 of the fanned RTL from 10:45.
The last bar of the day is a P2 of the trend short that started at bar11:45. We use the prior bar's high at pt1 and bar11:45's high as pt3.
Bar12:00 is a new pt3 for the short. It could have also been a BO,T1 but it broke the RTL on decreasing volume, if it was defined as that then the last bar would also be a BO,T1. The opening bar will either be a P1 and continuing the short or a T1 and setting a RTL for a long traverse.
PRV or pace lines would give an early indication of the above on opening volume.
")