On 10-case geometry and beyond

This might help.

View attachment 182713 View attachment 182714 View attachment 182715 View attachment 182716

There are two sheets that are composed of 5x5 bars in a 5x5 grid. Each bar represents 1min timeslice. This is an exercise in discerning Dominance and non-Dominance in a turn that is first observed in the 'shadow' of the bar as it builds.

The 10 cases of price go through a transformation intra-bar. What the bar first presented is different than midway or toward the close. Observing changes in volume pace is an essential aspect of Jack's work. Calibration of volume pace comes faster when there are reference points of volume and how fast it took to build that volume as well as the path it took to get there.


One might have to rotate the grid until it matches the key sheet paired with that grid. This is the sheet that Jack would call a pre-primary in his RDBMS. The 'what came before this' question. As one looks through the permutations of the bar as it traverses from endpoint to endpoint, imagine volume increasing or decreasing and what came before influences what will come after this current bar. This will support clarifying Dominant and non-Dominant sentiment as a bar builds.

We use the initial 5x5 grid drill to create an alphabet. This alphabet can form words. The words create context.

The extended 5x5 grid is like a hologram where the 1st column of a 5 bar group is composed of each bar as it leads it's own column. The columns and bars traverse sequentially from left to right.

5 min, 5 ticks.

This will create a reference grid in your mind if you take on creating extended grids for yourself or as a start trace these.


aho!

five by five begins
alphabet to words
all sing together

View attachment 182717


note: grids rotate 90deg ccw, keys stay in portrait and overlay it's respectively paired grid. Each column of the grid has a spectrum of starting points for a bar and as a bar builds, any possible close prior to and including the 5th bar in the 5 bar group.

This is an idealized scenario, by grouping bars in different like-to-like and contra variations, different contexts are discerned.

The difference in Dominant turns and non-Dominant turns should get cleared up when doing the drill.

Either turn can happen on increasing or decreasing volume. It's the distribution of volume pace and price rate of change intra-bar that we are calibrating by the placement of volume pace lines on the volume pane.

This assists our unconscious in serving up 'knowing' during events of continuation and change.
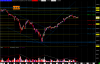

My view of the day:

View attachment 182718

I don't know ;)

Not on this fractal, maybe on the lower one!
 
An update of my NQ 15 MIN REFERENCE CHART.

The only container line updated is my "fanning tracker", the dashed blue.
And I updated the gaussians... please recall, the gaussians are tracking the largest container...
the high at the end of January, and the low of the recent pullback/correction/whatever it's being called. pt1 is the high, pt2 is the low, and we are moving to a pt3, and pt3 can not be higher than pt1 without negating/cancelling the container in it's entirety. That would make this entire sell-off a fanning of an up-sloping container, probably visible on a weekly or monthly time frame. Generally that's not useful for me, using a 5min or less time frame for trading.

I also added simple fib retrace levels, and also the naked POCs that I use, the usage of neither are related to JHM.

Now then, it is pretty clear (to me) the current up-slope container is "wrong". So at this time, this is an example that this stuff is ultimately self-correcting! Jack said many times you can begin annotating anywhere. Also, on the volume elements document, P1 (pt1) is "assigned." Just saying.

Of note is the existing gaussian DV-B/IV-R rotation I'm annotating. There was IV on the 2/15 down move and it quickly faded. Thus far in the CURRENT 2/16 - 2/19 down move IV again is seen, but to a lessor extent. Today 2/19 was a shortened holiday session. But if you look closely, you can see a clear pt1,p2,pt3 on some fractal. The RTH open should be interesting. Also, assuming the BR rotation being annotated is correct, what volume segments must occur for change? Food for thought?

Yes, I know... I've probably jumped a fractal or two already... Im the master!! :\
 

Attachments

  • NQ15update.png
    NQ15update.png
    74.6 KB · Views: 57
Sierra Charts?

An update of my NQ 15 MIN REFERENCE CHART.

The only container line updated is my "fanning tracker", the dashed blue.
And I updated the gaussians... please recall, the gaussians are tracking the largest container...
the high at the end of January, and the low of the recent pullback/correction/whatever it's being called. pt1 is the high, pt2 is the low, and we are moving to a pt3, and pt3 can not be higher than pt1 without negating/cancelling the container in it's entirety. That would make this entire sell-off a fanning of an up-sloping container, probably visible on a weekly or monthly time frame. Generally that's not useful for me, using a 5min or less time frame for trading.

I also added simple fib retrace levels, and also the naked POCs that I use, the usage of neither are related to JHM.

Now then, it is pretty clear (to me) the current up-slope container is "wrong". So at this time, this is an example that this stuff is ultimately self-correcting! Jack said many times you can begin annotating anywhere. Also, on the volume elements document, P1 (pt1) is "assigned." Just saying.

Of note is the existing gaussian DV-B/IV-R rotation I'm annotating. There was IV on the 2/15 down move and it quickly faded. Thus far in the CURRENT 2/16 - 2/19 down move IV again is seen, but to a lessor extent. Today 2/19 was a shortened holiday session. But if you look closely, you can see a clear pt1,p2,pt3 on some fractal. The RTH open should be interesting. Also, assuming the BR rotation being annotated is correct, what volume segments must occur for change? Food for thought?

Yes, I know... I've probably jumped a fractal or two already... Im the master!! :\
 
NQ 15 Min Chart

View attachment 182877

NQ 15.Min deGap Chart

View attachment 182878

Note the difference.

Of course!!... Damn, I could have had a V8!!

Seriously though... I mentioned my up-slope container was "wrong" in the post.
I have not updated it... Still looking for pt3 of the "rainforest+sierra desert" sell-off container. Unless/until pt1 is broken the container is valid.

In a quick glance of NQ weekly and monthly, it does appear the entire sell-off is contained so either option, a pt3, or a cancelled container of the selloff remains possible.

Life is good either way... trading fast charts intraday... Takin names and kickin butt!!

FWIW... Volume of the current down move today at noon pst, is confirming a pt3, so far. On the 15min.
 
Last edited:
Yea.
An ftt of the up-slope container, followed with a R2R breakout, all of which is properly defined with the volume sequence, and the necessary/expected PV for each event.

Hey stepan7... Thanks for the charts and your input! Nice knowing other goofballs like me are still alive and, I'm just taking an educated guess, doing very well! :)
 
NQ 15.Min deGap Chart

Have my posts deleted and misrepresent if you must,
{fortes fortuna juvat}
but I am glad that you have finally embraced the deGap chart. You will learn a lot and if you get to the POINT of clarity you will realize that you do not need the deGap chart at all!!!

I was at the NYC expo in 2007 and at the dive bar when all " the HACK " was interested in was collecting $60 entry fee. Ask questions! answers will come if they are relevant.

No ego, No arrogance!

Why are you calling Spydertrader "the HACK"?
 
Back
Top