From:
https://www.priceactionlab.com/Blog/2015/09/jim-simons-trend-following-broken/
(Michael Harris, the author, is very nice and generous about the subject; I am not).
Jim Simons has expressed his views about trend-following during a TED interview.
Revised February 21, 2019.
During a
Ted interview, Jim Simons showed a commodity chart and talked about how in the past traders were able to use 20 days of prices (and their average) as a predictor of future prices (about 13:00 minutes from start).
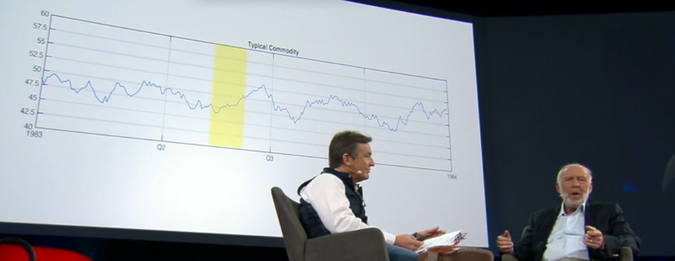
Jim Simons called that trend-following and argued that it no longer works. But some academic papers base the efficacy of trend-following on t-statistics derived from long-term data series and very slow moving averages .
In my book,
Fooled by Technical Analysis, I discuss the perils of using the t-statistic and hypothesis testing in trading system development. Using a t-statistic is really a rudimentary mistake. If you have 100 years of data, even a horrible Sharpe ratio in the order of 0.30 will generate a high t-statistic, as follows
t-statistic = Sharpe ratio × SQRT(number of years)
For Sharpe ratio of 0.30 in the course of 100 years, the t-statistic is 3.00. Does this mean that a trading system is significant? What about if the drawdown is -50%? Do fund managers like a -50% drawdown? Some close shop after a -10% drawdown.
Thus,
the first problem is that
long-term backtests can be misleading. Especially problematic are backtests on a basket of commodities because of hindsight bias.
Then,
another problem is that when one tests many choices of parameters, data-mining bias is introduced due to multiple comparisons. Actually, the whole procedure usually followed is based on multiple comparisons of different moving average crossover values and testing periods. In this case, the t-statistic must be adjusted and significance is lost, as Harvey and Liu showed in their paper.
More importantly…
The argument is not whether someone today can or cannot find a trend-following system that will work. This is possible and such systems may exist. The argument is about changing market conditions that render short-term trend following unprofitable.

I did not test a basket of commodities because that can introduce a lot of hindsight bias. The more instruments there are, the higher the bias. I just used the most popular index, the S&P 500, to show that Jim Simons is right and fast trend-following stopped working in the early 1990s. This is also confirmed by my
Momersion indicator.
Longer-term trend-following appears to work only for those that underestimate risks. Below is the performance of a 50-200 moving average crossover in SPY since inception:

The maximum drawdown is -35%. This system has a t-statistic of about 2.06, which is borderline significant depending on assumptions.
The question is:
Would anyone trust life savings or client funds on this system or on a similar system? I would not. I think Jim Simons would not either and this is why he claimed that trend-following is broken.

