Quote from Tsing Tao:
Now you're expanding the timeline. Good.
Did you know that the average earth's temperature during the dinosaurs was almost 18 degrees hotter than it is today? I didn't know it was that much hotter until I looked it up.
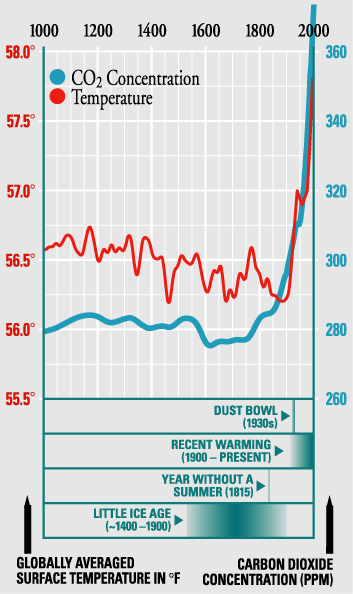
So if the dinosaurs lived 245 million years ago, and the temperature back then was much hotter than it is today, logic would say there were significant heat spikes in earth's 4.25 Billion year lifespan (unless the dinosaurs were driving cars and stuff). So the fact that your chart is indicating a "spike" of two degrees over the last 200 years isn't really indicative of anything. Sure, CO2 is a greenhouse gas (I'll not argue that it isn't). But how do you know that the 2 degree differential is because of CO2? Because you can show a chart showing the correlation of the two data points? I could show a chart showing how radio frequency use over the last 200 years has spiked, too. Does that mean radio frequencies contribute to global warming?
As I said in the beginning, this isn't my topic of expertise, so all I can rely on is logic. But it would seem to me you haven't proven anything other than two data sets matching on a chart that is scaled for both to exist.