
Not 97% but .3% of Climatologists agree.

Quote from Tsing Tao:

Show me where the long term temperature charts are - long term relative to the age of the earth. If I'm trying to make a point about what Tolstoy was trying to say in War and Peace, I don't link to the whole novel and expect you to go read it. I link to the relevant data.

As for why I am fixated on the past, it is completely relevant to the discussion. If you show me a chart that says temperatures have been warming over the last 150 years, and then say it's due to C02 because you show how CO2 has been increasing over the last 150 years, that's correlation, not causation.

I'd like to see a bit more evidence in the data set, since the earth is a helluva lot older than 150 years. Otherwise you're just blowing smoke.

CO2 is a greenhouse gas. Why is it so hard to make the logical leap that when levels of it rise then so will temperatures? Are you stupid?

The past is mostly irrelevant because we were not releasing 9 billion tons of CO2 per year into the air. The last thousand years are quite adequate to show the effect.

I'll try another chart.
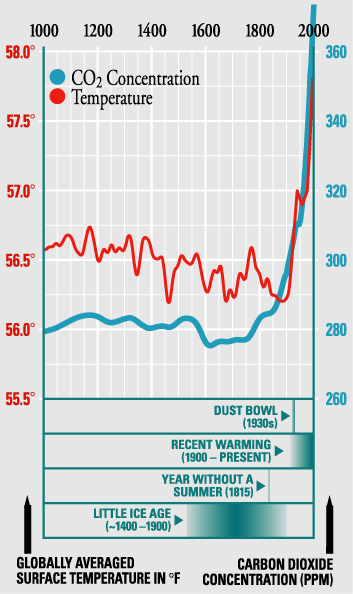
 
historical03.gif
 
http://www.climatechangedispatch.co...ture-rises.html

In a study recently published in Global and Planetary Change, Humlum et al. (2013) introduce their analysis of the phase relation between atmospheric carbon dioxide concentration and mean global air temperature by noting that over the last 420 thousand years, "variations in atmospheric CO2 broadly followed temperature according to ice cores, with a typical delay of several centuries to more than a millennium," citing Lorius et al. (1990), Mudelsee (2001) and Caillon et al. (2003).

And they explain this relationship by stating it "is thought to be caused by the slow vertical mixing that occurs in the oceans, in association with the decrease in the solubility of CO2 in ocean water, as its temperature slowly increases at the end of glacial periods (Martin et al., 2005), leading to subsequent net out-gassing of CO2 from the oceans (Togweiler, 1999)."

So if this be true for glacial cycles, should it not also be true for seasonal cycles?

Feeling that such might indeed be the case, the three Norwegian researchers intensively studied the phase relations (leads/lags) between atmospheric CO2 concentration data and several global temperature data series - including HadCRUT, GISS and NCDC surface air data, as well as UAH lower troposphere data and HadSST2 sea surface data - for the period January 1980 to December 2011. And what did they find?

Humlum et al. report that annual cycles were present in all of the several data sets they studied and that there was "a high degree of co-variation between all data series ... but with changes in CO2 always lagging changes in temperature." More specifically, they state that "the maximum positive correlation between CO2 and temperature is found for CO2 lagging 11-12 months in relation to global sea surface temperature, 9.5-10 months [in relation] to global surface air temperature, and about 9 months [in relation] to global lower troposphere temperature," so that "the overall global temperature change sequence of events appears to be from the ocean surface to the land surface to the lower troposphere."
 
Quote from jem:

http://www.climatechangedispatch.co...ture-rises.html

In a study recently published in Global and Planetary Change, Humlum et al. (2013) introduce their analysis of the phase relation between atmospheric carbon dioxide concentration and mean global air temperature by noting that over the last 420 thousand years, "variations in atmospheric CO2 broadly followed temperature according to ice cores, with a typical delay of several centuries to more than a millennium," citing Lorius et al. (1990), Mudelsee (2001) and Caillon et al. (2003).

And they explain this relationship by stating it "is thought to be caused by the slow vertical mixing that occurs in the oceans, in association with the decrease in the solubility of CO2 in ocean water, as its temperature slowly increases at the end of glacial periods (Martin et al., 2005), leading to subsequent net out-gassing of CO2 from the oceans (Togweiler, 1999)."

So if this be true for glacial cycles, should it not also be true for seasonal cycles?

Feeling that such might indeed be the case, the three Norwegian researchers intensively studied the phase relations (leads/lags) between atmospheric CO2 concentration data and several global temperature data series - including HadCRUT, GISS and NCDC surface air data, as well as UAH lower troposphere data and HadSST2 sea surface data - for the period January 1980 to December 2011. And what did they find?

Humlum et al. report that annual cycles were present in all of the several data sets they studied and that there was "a high degree of co-variation between all data series ... but with changes in CO2 always lagging changes in temperature." More specifically, they state that "the maximum positive correlation between CO2 and temperature is found for CO2 lagging 11-12 months in relation to global sea surface temperature, 9.5-10 months [in relation] to global surface air temperature, and about 9 months [in relation] to global lower troposphere temperature," so that "the overall global temperature change sequence of events appears to be from the ocean surface to the land surface to the lower troposphere."


Yes CO2 is a greenhouse gas and we are putting 9 billion tons of it into the air every year.
 
Quote from futurecurrents:

Yes CO2 is a greenhouse gas and we are putting 9 billion tons of it into the air every year.

Over and over again... 9 billion tons, 9 billion tons, 9 billion tons... like a retarded parrot.

The 9 billion tons that man puts into the air is a miniscule percentage of the CO2 that nature puts into the air each year.
 
Quote from gwb-trading:

Over and over again... 9 billion tons, 9 billion tons, 9 billion tons... like a retarded parrot.

The 9 billion tons that man puts into the air is a miniscule percentage of the CO2 that nature puts into the air each year.

CO2 is a greenhouse gas


CO2-Emissions-vs-Levels.gif
 
Back
Top