so can you tell me how to tell when the price will rise or drop?9000, in that case, is more like an 80% gain. And 1000 is not a cheaper stock (10x more layout). The reason for the cheaper stock could be the extra volatility you get, but could also be the ability to run a portfolio with less outlay.
In my opinion you have to test enough data to get an idea of your expected drawdown, which will in turn determine how much leverage you can use. Then start compounding by always having max applied size the drawdown will allow. 20% per month and you are a millionaire in two years starting with $1000. But for those two years you'll have to have a way to pay the bills. The timeframe you trade on will greatly affect the drawdown. It's one advantage for day traders who may then be able to leverage up. But the alternative to day trading is a portfolio, as uncorrelated as possible. This too would keep the drawdown average low.
Now I'll quote Semperfrosty:
"
Learn to identify a trend.No one will be able to tell you exactly how to do that.It will be your own parameters.
Learn to identify where price tends to stop and start.
Realise that you are playinga game of probabilities,attempting to put the odds slightly in your favour."

You are using an out of date browser. It may not display this or other websites correctly.
You should upgrade or use an alternative browser.
You should upgrade or use an alternative browser.
noob questions and how do people get rich trading!?
- Thread starter ineedmoney90
- Start date
How soon do you need money?so can you tell me how to tell when the price will rise or drop?
How much do you need?
How much seed money do you have?
How much time are you ready, willing and able to commit per week?
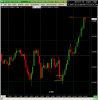
Who can tell you, for sure, is a Tradingview subscription and an Excel subscription.so can you tell me how to tell when the price will rise or drop?
9000, in that case, is more like an 80% gain. And 1000 is not a cheaper stock (10x more layout). The reason for the cheaper stock could be the extra volatility you get, but could also be the ability to run a portfolio with less outlay.
In my opinion you have to test enough data to get an idea of your expected drawdown, which will in turn determine how much leverage you can use. Then start compounding by always having max applied size the drawdown will allow. 20% per month and you are a millionaire in two years starting with $1000. But for those two years you'll have to have a way to pay the bills. The timeframe you trade on will greatly affect the drawdown. It's one advantage for day traders who may then be able to leverage up. But the alternative to day trading is a portfolio, as uncorrelated as possible. This too would keep the drawdown average low.
Now I'll quote Semperfrosty:
"
Learn to identify a trend.No one will be able to tell you exactly how to do that.It will be your own parameters.
Learn to identify where price tends to stop and start.
Realise that you are playinga game of probabilities,attempting to put the odds slightly in your favour."
Thanks Goody!
Nice to know I'm not talking crap! haha

I've contributed ideas about how to mesh Tradingview with Excel to be able to efficiently collect data so you can verify an idea, preferably a trend following idea. Here is that collection of ideas:so can you tell me how to tell when the price will rise or drop?
https://www.elitetrader.com/et/thre...anual-strategy-testing-on-tradingview.370042/
I have recently come up with an even simpler idea that would allow you to gather about 75 data points an hour. First you should do hundreds. Then if it still looks promising, you'll need thousands of data points to really establish the expected drawdown and other important statistics. I will posit the idea there soon.
Or, you can go directly to coding your idea and have the code gather and examine, much faster, data points, but most people don't have that ability so that's why there will always be a place for manual data gathering. If you can find a Pine Script that actually delivers a profit factor above 1.3 you've gotten very lucky. But how lucky are you if the script only trades five times a year waiting on some very unusual circumstances, some big standard of deviation outlier? In other words, people aren't putting out their best work in free scripts. But you might get lucky. Better to have manual skills, and VBA skills.
You should be able to be in the market at all times with reasonable expectation of being consistently profitable in both directions. That is really the best definition of swing trading. Everything else is frosting on the cake. But frosting alone is not a cake. You cant "fade" a trend till you have a good idea what the trend is in the first place. Same thing, you cannot get into a trend on a pull back (frosting) till you have a good idea what trend you are trying to get into. If there is no way to define that trend, then good luck you'll need it. Without having a way to measure the beginning end of trend, people generally just observe the stock market goes up in any ten year period. And just go long. And buy dips. I could not live that way though. Nicolas Darvas found a way to measure begin and end of trend. He only went long but still did much better than average. The Turtles also found a way to describe begin and end of trend. They were in commodities so had the luxury to go long or short.
Last edited:
how to read candle sticks!?
%%how to read candle sticks!?
SAME speed you get rich\get rich slow. Cant predict/that's why they call it weather forecasting not weather prediction.
SPY benchmark candlecharts are just a pic of price + fundamentals; you may want to get a public library card or private library or both. I like both myself because both of those tend to be much, much more accurate than lotto losers\players on the internet

Back to regional bank downtrends + buy SPY monday bull market;
not a prediction\ just a forecast......................................
are the best stocks to buy volatile stocks!?
%%are the best stocks to buy volatile stocks!?
YES/ basket of them partly.
Sometimes they beat SPY benchmark+ sometimes they dont beat SPY or DIA/DOW all year;
so it pays to scale in more than one sector or benchmark in the long run.
I still like XLE sector , but it may not be a good of year for them like2021??

Cant predict, can work well, wise + forecast, track trends+ avoid penny stocks.Read a lot
how to read candle sticks!?
More important than candlesticks is, imo, patterns:
What I dislike in so many lessons that make claims is a total lack of statistics. For example, in this otherwise pretty good patterns video, the author continually emphasizes you should wait for price to retrace back to the breakout before entering in the direction it's supposed to go...and then set a target of 3x the stop. In marketing they call it A-B testing. How do you know B is better till you test A? As I've said, you want the cake and the frosting, not just the frosting. If B works better, it's because A already has some validity. You need that validity since that is what determines the *;!$# trend! So that is where a spreadsheet and statistics come in. You try it both ways. Maybe you want both as A and B might just represent two parts of one portfolio.
The other thing that bothers me about representing patterns this way is it is unecessarily complicated to come up with so many names for what is the same thing: a reversal point!
What you should be able to do is use any of these patterns as a reversal, and instead of a target, you should be able to use one of the "opposite" patterns as a turn-around. Thus, if you just go with the flow, ignoring the retracement and target scenarios, you should be able to be in market at all times, either long or short, and be generally profitable in both directions given 300 data points. Only if this is valid would the other scenario be also valid, as it represents another way to get into and out of...a trend! You first have to have right the direction of the basic trend.
If you go with plan A (no stops or targets, only reversals) you should win only 40% of the time, but enjoy a 2x bigger wins average than losses. Scenario B will yield it's own statistics and it's own equity curve, ideally one that compliments the curve of scenario A in a somewhat uncorrelated way. Thus while A is going down, maybe B is going up, and visa versa. In which case you would want to split your capital between them.