It seems you are trolling gwb. Why should gwb bother to do something to try and convince you that vaccination works. The data is available to you, just as it is to him. At this point, only a fool would question the efficacy of the mRNA vaccines . They are among the most effective vaccines ever developed.So show the statistics of Chile's cities. Pick Santiago. Where are the cases per 1M pop? Let's see the apples-to-apples. You might actually be correct, and Florida is worse off.

You are using an out of date browser. It may not display this or other websites correctly.
You should upgrade or use an alternative browser.
You should upgrade or use an alternative browser.
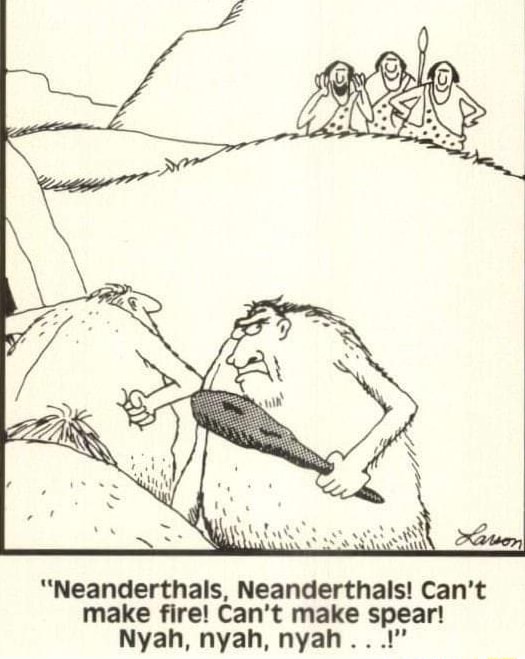
Neanderthals vs. "Science"
- Thread starter Tsing Tao
- Start date

It seems you are trolling gwb. Why should gwb bother to do something to try and convince you that vaccination works. The data is available to you, just as it is to him. At this point, only a fool would question the efficacy of the mRNA vaccines . They are among the most effective vaccines ever developed.
First, its my thread. I'm not trolling anyone. If you want to come here and challenge something, feel free - just do it with data and not just conjecture. GWB's problem is similar to yours: You guys believe very strongly but don't want to put forth the effort to prove anything you believe.
That's fine, believe with all your might, hope on all the hope. Remember the old adage about shitting in one hand and hoping in the other, and seeing which one fills up first?
"most effective vaccines ever developed" is a massive laugh, though. I appreciate you, man!
In the U.S., mandates are not the same as conformance. In Japan and Germany maybe, but not in the U.S. And, no, of course you can't do what you say you've done, not without cherry picking the time periods, States and Countries and confusing the "shape" of the virus curve with the infection rates it represents. Pay attention to the scale of the y-axis. Two of these curves can have the same general shape and one represent significantly higher infection rate than the other depending on the numbers on the y-axis.
Can you clarify which graph you are rambling about so that I might bring some signal to the noise you just sputtered?
How can you explain the infection rate difference between Chile and Florida on the basis of a population density computed by dividing total area into population! You can't! People are never distributed uniformly. And if you used surface rather than geodesic area to compare Florida with Chile your result would be even more absurd. I would guess Chile has a somewhat higher population density than Florida.
The comparison between Chile and Florida was GWB's, not mine. I'm not the one trying to compare the two places. In fact, I'm trying to make the point that there isn't an easy way to compare the two because there are so many different variables playing a part. In fact, I even showed GWB's post when he stated you can't compare two different geographies because it is worthless. Of course, he made that point when it helped him and is ignoring it now that he's on the other side of the coin.
As for what you would "guess", I'm really not interested unless you've got data to back it up. That's the problem GWB (and now you) have. Always about what you think and claiming its true. Show me what on the posted charts is wrong. That is backed by data. And the data is showing that mask mandates and highly vaccinated percentage population in Chile hasn't made a damned bit of difference to the virus curve. Nada. Zilch.
What's is interesting is that Japan had, in comparison with the U.S., a low vaccination rate (though this is changing), a significantly higher population density and an almost universal conformity to mask wearing in public; far better than in the U.S. (The masks there are not all N95 by any means.) Yet Japan had, and continues to have, a significantly lower infection rate than the U.S.) I regard the lower transmission rate in Japan as due to high conformance to mask wearing. It appears that masks do, indeed, work. If they don't seem to, it is most likely due to poor conformance.
You are certainly entitled to your own speculation. But the data indicates otherwise.

You need to post excel charts from facebook that have a similar shape & lead to correlation/causation fallacies; that's the secretIt seems you are trolling gwb. Why should gwb bother to do something to try and convince you that vaccination works. The data is available to you, just as it is to him. At this point, only a fool would question the efficacy of the mRNA vaccines . They are among the most effective vaccines ever developed.

You need to post excel charts from facebook that have a similar shape & lead to correlation/causation fallacies; that's the secret
Excel charts of any kind would be a step up from the "believe me, I feel very strongly about this" method they (and you) tend to use.
Possibly the reason people are not posting much actual data is it is all over the internet, both the cooked and the uncooked. And when you limit it to reliable sources such as the CDC , the WHO, etc., anyone can see that the data, after something like a billion doses of vaccine having been delivered, shows the amazing effectiveness of the Covid-19 vaccines, especially the Moderna and Phizer vaccines. It is so easy to access this data, why not just do that, and stop trolling people to post data.First, its my thread. I'm not trolling anyone. If you want to come here and challenge something, feel free - just do it with data and not just conjecture. GWB's problem is similar to yours: You guys believe very strongly but don't want to put forth the effort to prove anything you believe.
That's fine, believe with all your might, hope on all the hope. Remember the old adage about shitting in one hand and hoping in the other, and seeing which one fills up first?
"most effective vaccines ever developed" is a massive laugh, though. I appreciate you, man!
Possibly the reason people are not posting much actual data is it is all over the internet, both the cooked and the uncooked. And when you limit it to reliable sources such as the CDC the WHO etc. anyone can see that the data, after something like a billion doses of vaccine having been delivered, shows the amazing effectiveness of the Covid-19 vaccines, especially the Moderna and Phizer vaccines. It is so easy to access this data, why not just do that, and stop trolling people to post data.
But the data in the charts I post are coming from the CDC, WHO, NYT and other official sources. So it should meet with your standards.
Feel free to debate it, if you can. Or you can just post conjecture and what you think. That's not as interesting to me, but you at least feel better.