My personal FX pairs and XAUUSD analysis

Status
Not open for further replies.
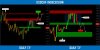
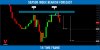
#USDCHF: Bearish Move From Key Level

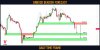
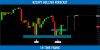
USDCHF looks overbought to me,
The price formed a double top pattern approaching a key structure resistance.
Its neckline has been just broken.

Probabilities are high that we will see a correctional movement on the pair.
Goals: 0.935 / 0.931
 

Attachments

  • usdchf.jpg
    usdchf.jpg
    63.7 KB · Views: 5
#CADJPY: Classic Trend-Following Setup
CADJPY broke and closed below a support line of a bearish flag pattern.
Taking into consideration, that the pair is trading in a bearish trend,
that violation may trigger a sell off.
I expect a bearish continuation to 97.05 / 96.1
 

Attachments

  • cadjpy.jpg
    cadjpy.jpg
    100.8 KB · Views: 4
#USDCHF: Detailed Technical Outlook
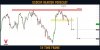
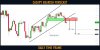
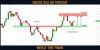
⚠️USDCHF is currently consolidating.
The price is stuck between 2 horizontal key levels that compose a range.
0.9425 - 0.946 is the resistance of the range.
0.9285 - 0.9306 is the support of the range.
Depending on the reaction of the price to its boundaries,
I see 2 potential scenarios:
1️⃣If the price breaks and closes above the resistance of the range,
a bullish continuation will be expected at least to 0.9537.
2️⃣If the price breaks and closes below the support of the range,
a bearish move will be expected to 0.9193 support.
Wait for a breakout, that will clarify the future direction of the market.
Also use Directional Indicator for confirmation!
 

Attachments

  • usdchf.jpg
    usdchf.jpg
    120.9 KB · Views: 4
Binance Coin (#BNBUSD): Very Bearish Outlook! Here is Why:
Have you seen that huge head & shoulders pattern that was formed
on Binance Coin on a daily.
After yesterday's fundamentals, the price successfully violated its neckline and closed below that.
Probabilities are high now, and the market will keep falling.
Goals: 256 / 243
 

Attachments

  • bnbusd.jpg
    bnbusd.jpg
    56.8 KB · Views: 4
Gold (#XAUUSD): Important Bullish Clue on a Weekly
Gold has nicely respected a major weekly structure support.
The market formed a bullish engulfing candle after the test of structure,
and then we saw a very nice rejection from that.
It looks like Gold may go higher.
Next resistance 1925.
Remember, that weekly time frame chart unveils a long-term perspective.
So it may take weeks, before the price reaches the target.
 

Attachments

  • gold.jpg
    gold.jpg
    94.2 KB · Views: 3
#GBPAUD: Time For Pullback
GBPAUD reached a key daily structure resistance.
The market was nicely rejected from that on 4H first,
then, a bearish engulfing candle was formed.
I expect a retracement from that structure.
Goal - 1.804
 

Attachments

  • gbpaud.jpg
    gbpaud.jpg
    97.3 KB · Views: 3
S&P500 Index (#SPY) Bearish Outlook Explained

S&P500 reached a solid horizontal key level.
The price formed a tiny double top on that and a doji candle.
Now, bears are pushing.

I expect a fall to 3886 / 3851
 

Attachments

  • 500.jpg
    500.jpg
    57.4 KB · Views: 2
#NZDJPY: Pullback From Key Level
NZDJPY formed a cute double bottom pattern on a solid support on 1H time frame.
Its neckline has just been broken.
I expect a pullback to 83.24
 

Attachments

  • nzdjpy.jpg
    nzdjpy.jpg
    52.6 KB · Views: 2
It is really really really time for you to do live trading rather than giving advice to newbies.


No point telling us all the support resistance double top double bottom
triple top triple bottom doji pattern butterfly Gartley pattern
bullish engulfing bearish engulfing three white soldiers
three back soldiers head shoulder head dark cloud cover
floor ceiling moving average cut stochastic cut neck line broken structural things.


You can never learn unless you do live trading.
When you enter the live trade, just let us know when precisely when you enter,
and where is your hard stop.
It is very important you document your live trading in this Journal.
And that is how to track your progress.

In summary, time for you to progress.
Instead of giving advice,
go do live trading.
And document your trades here.

It is very clear based on your 76 postings, you have lots and lots of things to learn
about trading.

Just ask this very simple question : Who would trade NZD when NZD is sleeping ?!?!?!?!?!?


All the best mister.
 
Last edited:
#NZDJPY: Pullback From Key Level
NZDJPY formed a cute double bottom pattern on a solid support on 1H time frame.
Its neckline has just been broken.
I expect a pullback to 83.24

NZD and Japanese Are SLEEPING !!!

Your average win rate is going to be less than 10%.
Really no hope for you.

you have tons of things to learn howto trade
 
Last edited:
Status
Not open for further replies.
Back
Top