My personal FX pairs and XAUUSD analysis

Status
Not open for further replies.
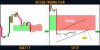
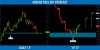
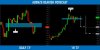
#AUDNZD: Bearish Outlook Explained
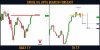
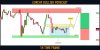
AUDNZD is testing a wide daily horizontal supply area.
The price formed a double top pattern, approaching that on an hourly time frame
and broke its neckline with a high momentum bearish candle.
I expect a retracement to 1.0848 / 1.0828
 

Attachments

  • audnzd.jpg
    audnzd.jpg
    102.5 KB · Views: 2
S&P500 Index (#SPY): Time to Sell
S&P500 Index is testing a wide daily horizontal resistance cluster.
Probabilities will be high to see a bearish reaction from that.
I believe that the market may drop today to 4032 / 4021 levels.
MACD Indicator
 

Attachments

  • spy.jpg
    spy.jpg
    98.3 KB · Views: 3
BITCOIN (#BTCUSD): Detailed Technical Outlook ₿
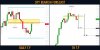
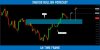
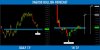
⚠️Bitcoin successfully violated a wide horizontal daily demand area.
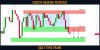
The broken structure turned into a supply zone.
The market is correcting now.
I spotted a bearish flag pattern on 4H time frame.
Its bearish breakout may initiate the next sell off.
Watch carefully the reaction of the price to its rising support.
Consider shorting after a 4H candle close below with initial target being 22100.
 

Attachments

  • bitcoin.jpg
    bitcoin.jpg
    66.3 KB · Views: 3
Gold (#XAUUSD): Time For Pullback
Gold is approaching a wide horizontal demand cluster on 4H.
Taking into consideration, that the market is trading in a minor bullish trend,
probabilities will be high to see a pullback from the underlined area.
I expect growth to 1855 / 1862
Best Gold Trading Robot - Scouts Gold V9 Robot
 

Attachments

  • gold.jpg
    gold.jpg
    92 KB · Views: 3
Crude Oil (#WTI): Bearish Outlook Explained
WTI Crude Oil reached a key daily structure resistance.
The price formed a tiny little double top on that on 1H time frame.
Its neckline has been just broken.
The market will most likely keep retracing.
Goals: 79.9 / 79.6
Best Scalping Indicators
 

Attachments

  • oil.jpg
    oil.jpg
    64.2 KB · Views: 1
Dow Jones Index (#US30): Key Levels to Watch This Week
Here is my latest structure analysis for US30 Index.
Support 1: 32470 - 32650 area
Support 2: 31700 - 31975 area
Resistance 1: 33475 - 33660 area
Resistance 2: 34300 - 34500 area
Resistance 3: 34820 - 34900 area
Vertical Resistance 1: major rising trend line .
Currently, the market is approaching a confluence zone based on Vertical & Horizontal Resistance 1.
Probabilities will be high to see a pullback from there.
Consider the underlined structures for pullback/breakout trading.
 

Attachments

  • us30.jpg
    us30.jpg
    115.5 KB · Views: 2
#AUDCAD: Time to Grow
AUDCAD dropped to a key daily structure support.
The price formed a double bottom pattern, testing that on 1H,
its neckline was broken then.
I expect a bullish move to 0.91 / 0.9117
 

Attachments

  • audcad.jpg
    audcad.jpg
    102 KB · Views: 2
#EURCHF: Your Trading Plan For Today
⚠️EURCHF is currently consolidating.
The pair is trading within a wide intraday trading range.
Currently, the price is approaching its lower boundary.
To buy the pair with a confirmation, watch a double bottom pattern.
0.994 - 0.9943 is its neckline.
Wait for an hourly candle close above that (it will confirm a breakout),
buy aggressively or on a retest then.
Target will be 0.996
If the price sets a new lower low, the setup will be invalid.
Also use RSI Indicator for confirmation.
 

Attachments

  • eurchf.jpg
    eurchf.jpg
    107.7 KB · Views: 1
#CADCHF: Important Breakout
CADCHF was coiling for more than a month within a wide horizontal trading range on a daily.
Its support was finally broken yesterday.
I believe that the pair will keep falling now.
Next support - 0.679
 

Attachments

  • cadchf.jpg
    cadchf.jpg
    111.6 KB · Views: 2
Status
Not open for further replies.
Back
Top