What duration of time does that chart cover?Exactly! The Russell 2000 Index has become a value index with small size tilt. It's highly correlated with DIA in the last few years. The Dow Jones index is widely seemed as a proxy to the value, similar to IWD but with futures. Institutional investors tend to use e-mini futures to get quick exposure to either value and growth, the widest followed styles.
Following is an example from the process outlined in the beginning:
You are using an out of date browser. It may not display this or other websites correctly.
You should upgrade or use an alternative browser.
You should upgrade or use an alternative browser.
Market timing and style rotation
- Thread starter Junkou
- Start date
Very interesting stuff. I'd like to try and test this in Amibroker but not sure how to start. Can you please do a post on each of the steps for "Question 3: Can you predict whether NASDAQ 100 INDEX will outperform the Russell 2000 Index in the short term"
Thank you for an enlightening post (very rare thing in these boards lol).
Thank you for an enlightening post (very rare thing in these boards lol).
I tried a variation of this idea with the daily low prices of iShares Russell 2000 Value ETF (IWN) divided by the daily low prices of Invesco QQQ Trust (QQQ) then multiplied by 100. For the relative performance I fitted a curve to this ratio for rolling 4 month periods. The curves had a parabola (y = a + b * x + c * x^2) added to a cosine wave that might be skewed for right or left translation. The fitted curve rises when IWN is performing better than QQQ and vice versa.I will answer the 3 questions to tell the story about market timing and style rotation:
It's very difficult if not impossible.
- Question 1: can you predict the short-term direction of Apple share price
If we write in a formula: d=f(x). There is only one variable, which has no boundaries and is free to move in any directions. You may say there are moving average lines that can be boundaries. However, these lines are not binding and the price is not necessary to move to those lines. Furthermore, those lines are also moving.
Short answer: it's possible even though still possible
- Question 2: can you predict whether Apple share price will outperform the S&P 500 Index in the short term
We now have two variables in the formula: d=f(x-y). With the S&P 500 Index as the reference, the range that Apple share price can move from the S&P 500 Index is relative stable and predictable. We can calculate the current standard deviation from its long-term mean. If it's in the middle, we can't predict the direction. If the current position is over 2 standard deviation from the long-term mean, we can say Apple share price is likely to underperform the index. On the other hand, if the current position is 2 standard deviation below the long-term mean, we can say Apple share price is likely to outperform the index.
It's possible and relative easy.
- Question 3: Can you predict whether NASDAQ 100 INDEX will outperform the Russell 2000 Index in the short term
Indexes in the US market can be classified as different styles. What is a style? A style is the common feature that drives the performance of a group stocks. The widely used styles are value and growth, and large and small. For example, the NASDAQ 100 Index is largecap stocks with growth oriented, and can be classified as growth and large. The Russell 2000 Index is small size and value.
How to model the relative strength of two styles then?
There are several steps:
Many academic researchers use daily data or even monthly data in their study. That's a mistake. Price-based models should include intraday pricing which contains more information.
- Calculate the relative performance of two styles. In this example, we can simple use the price ratio between the NASDAQ 100 INDEX and the Russell 2000 Index
- Apply standard pairs trading model to calculate the current standard deviation
- If the position is in the middle, use statistic models to determine whether there is a trend. Machine learning models can be used to estimate the thresholds
- If the position is at the upper bound or lower bound, apply mean reversion models to determine the reversion points. Again machine learning models can be used to estimate and optimize the thresholds
- If the position is in other places, use rules to control risks
How can we use the prediction from style rotation?
Long-only investors can change holdings with index-based ETFs accordingly.
A long/short portfolio can also be set up to achieve returns with very low correlation to the market.
Happy to share more details if you like this topic.
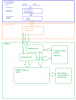
For example, here is an example of ratio values, parabola trend, and fitted curve for 123 calendar days starting 20121123 and ending 20130325.
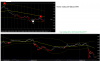
Here is the skewed cosine wave alone which is right-translated (falls faster than it rises).
The curve formula for this example is
Code:
y =
    100.706581115723 + 0.164993017911911 * x - 0.000613634416367859 * x^2 +
    0.475093841552734 * skewed_cos(twopi / 45.5548653679802, 1.6029417514801, -0.509737253189087,
x, 100)skewed_cos(freq, phase, skew, x, iter) = cos(freq * x + phase) when iter == 0
skewed_cos(freq, phase, skew, x, iter) = cos(freq * x + phase + skew * skewed_cos(freq, phase, skew, x, iter - 1)) when iter > 0
X values are calendar days since the beginning of the 123 calendar day input period.
I ran a long-only test with price data adjusted for splits and dividends from 20000728 through 20220414 using 4-months (123 calendar days) for each fitted curve (data was linearly-interpreted for non-trading days). If the skewed cosine wave was rising, a potential simulated trade would buy IWN at the next day close and sell IWN at the close on the day the skewed cosine wave was predicted to peak. If the buy and/or sell dates occurred on non-trading days, one or both would be moved to the next trading day. Also, simulated trades would only be entered if the overall fitted curve was predicted to go up for the potential trade duration.
The result was 1807 simulated trades with a mean result of +0.98%, median result of +1.06%, and 1161 simulated trades (64.25%) profitable (results not adjusted for slippage and commissions).
So, I conclude trading on style rotation with price ratios of two different assets can be profitable.
Last edited:
I tried a variation of this idea with the daily low prices of iShares Russell 2000 Value ETF (IWN) divided by the daily low prices of Invesco QQQ Trust (QQQ) then multiplied by 100. For the relative performance I fitted a curve to this ratio for rolling 4 month periods. The curves had a parabola (y = a + b * x + c * x^2) added to a cosine wave that might be skewed for right or left translation. The fitted curve rises when IWN is performing better than QQQ and vice versa.
For example, here is an example of ratio values, parabola trend, and fitted curve for 123 calendar days starting 20121123 and ending 20130325.
View attachment 282485
Here is the skewed cosine wave alone which is right-translated (falls faster than it rises).
View attachment 282486
The curve formula for this example is
whereCode:y = 100.706581115723 + 0.164993017911911 * x - 0.000613634416367859 * x^2 + 0.475093841552734 * skewed_cos(twopi / 45.5548653679802, 1.6029417514801, -0.509737253189087, x, 100)
skewed_cos(freq, phase, skew, x, iter) = cos(freq * x + phase) when iter == 0
skewed_cos(freq, phase, skew, x, iter) = cos(freq * x + phase + skew * skewed_cos(freq, phase, skew, x, iter - 1)) when iter > 0
X values are calendar days since the beginning of the 123 calendar day input period.
I ran a long-only test with price data adjusted for splits and dividends from 20000728 through 20220414 using 4-months (123 calendar days) for each fitted curve (data was linearly-interpreted for non-trading days). If the skewed cosine wave was rising, a potential simulated trade would buy IWN at the next day close and sell IWN at the close on the day the skewed cosine wave was predicted to peak. If the buy and/or sell dates occurred on non-trading days, one or both would be moved to the next trading day. Also, simulated trades would only be entered if the overall fitted curve was predicted to go up for the potential trade duration.
The result was 1807 simulated trades with a mean result of +0.98%, median result of +1.06%, and 1161 simulated trades (64.25%) profitable (results not adjusted for slippage and commissions).
So, I conclude trading on style rotation with price ratios of two different assets can be profitable.
Well done!
Most academic researchers also use daily pricing data even though some also include more data such as gold, interest rates, commodities, and FX pricing. However, my research shows that intraday data has much richer information, and therefore can improve the performance significantly. I mainly use 1-hour data and 2-hour data in modelling, and map into higher frequency in actual trading. I will show more details over the weekend!
If anyone wants to read more research papers, search "style rotation" on this website: https://www.ssrn.com/index.cfm/en/
I use daily data because it seems good enough for the swing trading I do.I mainly use 1-hour data and 2-hour data in modelling, and map into higher frequency in actual trading. I will show more details over the weekend!
If anyone wants to read more research papers, search "style rotation" on this website: https://www.ssrn.com/index.cfm/en/
I look forward to seeing more details.
I like IWM since there are leveraged versions of it both long & short (TNA & TZA) as well as futures which is even higher leverage depending on your broker. IWN is probably the ETF to use for even better alignment to the Value sectors but it doesn't have the liquidity.
I also like the pair of QQQ (TQQQ, SQQQ)-IWM(TNA, TZA) given that I can trade the pair in the retirement accounts which don't allow short. There are also e-mini, micro e-mini futures for automatic day trading.
Value is still better in the long-term during a rising rates environment.
Vehicles | April 4, 2022 12:55 pm
The RV Backlog Is Still Growing Two Years Into the Pandemic
That trailer you've been eyeing? It may be even harder to get today.

Get those Airstream orders in now.
https://www.insidehook.com/daily_brief/vehicles/rv-backlog-growing-two-years-pandemic

-vz