
You are using an out of date browser. It may not display this or other websites correctly.
You should upgrade or use an alternative browser.
You should upgrade or use an alternative browser.
Making JH' SCT and all his material alive
- Thread starter WchPl
- Start date

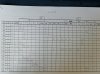
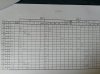
Chart & Log on 070319- part 3

For a reason that I currently ignore, on this session volume falls under 2.5k after bar 45; in addition to that, bar 45 is 13:10 and suddenly next bar is 18:00.
I don't know where this phenomenom comes from.
In any case, I can't ensue the log on this session due to low volume.
Next session will be 07/05/19 at 9:30am
For a reason that I currently ignore, on this session volume falls under 2.5k after bar 45; in addition to that, bar 45 is 13:10 and suddenly next bar is 18:00.
I don't know where this phenomenom comes from.
In any case, I can't ensue the log on this session due to low volume.
Next session will be 07/05/19 at 9:30am
Attachments
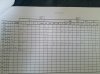
Chart & Log on 070319- part 3
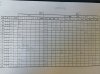
12:30 bar... PP1a is incorrect: there is no acceleration.
With that in mind, I would say the 12:40 OB bar is not PP4.
Not being a PP4 changes the turn-type annotation.
Starting at 12:40 bar
PP5 > P1 > P1 > PP1 > P1 > T1 > P2 > Ab
Last edited:
12:30 bar... PP1a is incorrect: there is no acceleration.
With that in mind, I would say the 12:40 OB bar is not PP4.
Not being a PP4 changes the turn-type annotation.
Starting at 12:40 bar
PP5 > P1 > P1 > PP1 > P1 > T1 > P2 > Ab
Thank you very much for your contribution.
AND
Here is my reasoning leading me to still see a PP1a :
From what I understand currently, for PP1 and PP1a, we need to see an acceleration on the dependant variable which comes from accelerating tl's
AND
the additional requirement is that one needs to have [P(1 or 2).0 - P(1 or 2).1] > [P(1 or 2).1 - P(1 or 2).2].
AND
we can have a INT between first and third P2, it will not kill the possibility of PP1a, according to the volume element ranges sheet (VERS).
It all starts here at bar 12:15 as for PP1a or not. From leftmost P2 to next bar which is wait, one has a tl. It's the pink one. When last (third) P2 has occured, the tl has been accelerated (dark one). So in terms of price, I see acceleration here.
AND
P2.0 = 8.181K
P2.1 = 8.144K
P2.2 = 8.140K
So we have (8.181 - 8.144) > (8.144-8.140) and the additional requirement is satisfied.
AND
it's not killed although we have a wait between the first two P2's.
So, either I'm, in fact, not clear with the concept, or maybe the size I posted the chart was not clear enough, or there is effectively a PP1a.
Thank you very much for your contribution.
AND
Here is my reasoning leading me to still see a PP1a :
Your PP1/PP1a reasoning regarding Wait and acceleration is correct. I might add there is no specific number limit or specific placement of wait(s)... so long as they occur in the same segment.
I also point out that in the commented upon snip, the PP1 was not recognized and annotations beyond need correction.
Chart & Log on 070519- part 2
Thread: SCTLearning From Scratch, Post: #125
By Jack... (highlight mine)
---------------------------------------------------------------------------------------
For volume there are peaks and troughs to use. They are P1, P2 and P3 and T1, and
T2P and T2F. They follow an order of events. P is asigned and other P1's are larger than the assigned. Ti is after a P1 when it is less than a P1. After a T1 the next peak is a P@ and never a P1. This forms the A band of bands. A P1 may follow a P2 if it exceeds the prior P1. P2's can follow P2's if the prior P2 is exceeded. when any peak question occurs use the leftmost in the test as written on the log.
T2P's appear after P2's and they are between P2 and T1 in value. A T2F can appear after a T2P and it is less than a T2P and more than a T1. The T2's are used to define the last move of a trend as a zone of values in the independent variable.
For volume, the test procedure detemines the OOE of a trend in the independent variable.
This is all that is annotated on bars or the highlighting of bars.
All trends come to ends as defined by the various End Effects.
This post completely defines the market variables in a bar by bar process. Trends are formed from these OOE's.
Look at thousands of annotated charts to learn to follow the trend process bar by bar.