
You are using an out of date browser. It may not display this or other websites correctly.
You should upgrade or use an alternative browser.
You should upgrade or use an alternative browser.
Making JH' SCT and all his material alive
- Thread starter WchPl
- Start date


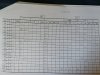
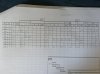

Chart & Log on 070319- part 3
View attachment 205923
For a reason that I currently ignore, on this session volume falls under 2.5k after bar 45; in addition to that, bar 45 is 13:10 and suddenly next bar is 18:00.
I don't know where this phenomenom comes from.
In any case, I can't ensue the log on this session due to low volume.
Next session will be 07/05/19 at 9:30am
Market holiday hours.
Thank you very muchMarket holiday hours.
Thread: SCTLearning From Scratch, Post: #125
By Jack... (highlight mine)
---------------------------------------------------------------------------------------
For volume there are peaks and troughs to use. They are P1, P2 and P3 and T1, and
T2P and T2F. They follow an order of events. P is asigned and other P1's are larger than the assigned. Ti is after a P1 when it is less than a P1. After a T1 the next peak is a P@ and never a P1. This forms the A band of bands. A P1 may follow a P2 if it exceeds the prior P1. P2's can follow P2's if the prior P2 is exceeded. when any peak question occurs use the leftmost in the test as written on the log.
T2P's appear after P2's and they are between P2 and T1 in value. A T2F can appear after a T2P and it is less than a T2P and more than a T1. The T2's are used to define the last move of a trend as a zone of values in the independent variable.
For volume, the test procedure detemines the OOE of a trend in the independent variable.
This is all that is annotated on bars or the highlighting of bars.
All trends come to ends as defined by the various End Effects.
This post completely defines the market variables in a bar by bar process. Trends are formed from these OOE's.
Look at thousands of annotated charts to learn to follow the trend process bar by bar.
I'm definitely overworked if I commit this kind of errors
I'm definitely overworked if I commit this kind of errors
Update :
After rethinking about it, here was the scenario :
10:45 : PP4 so if next bar is measurable, P1 will be assigned
10:50 : this bar is measureable, so P1 assigned.
10:55 : once degapped we have StR UL so P1 repeats
11:00 : relatively we have XB, volume is measured we have T1 under leftmost P1.
11:05 : XB, INC volume under leftmost P1, so P2.
11:10 : XB, INC volume above leftmost P1. It's a second P2 and it's above leftmost P1. If I'm not wrong, this fits the definition of a P1 revchron.
This reminds me the case when after P1 > T1 > T1 > P2 > volume above second T1 but below first T1 -> we had Ab LVBO. So we were using leftmost T1. I had missed that and had, before debrief, logged it as T2P.
With the same logic, I see here on bar 11:10 a second P2 AND it is above first P1 so I see P1 rev chron.
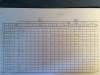
Chart & Log on 070819- part 1

I have to study the "both BO,T1 and BMrev" scenarios. It sounds to me like it deals with the OOE inside the OOE.
I see it like : BO,T1 happens before BMrev so I search for a link between PP4 and BO,T1, and then, being as the EE that came inside the OOE was BMrev, I next search for a link between BM,rev and, in this scenario posted, BO,T1.
It sounds logic to me right now, until I find in the litterature or any case in a future log something that makes it sound wrong.
I have to study the "both BO,T1 and BMrev" scenarios. It sounds to me like it deals with the OOE inside the OOE.
I see it like : BO,T1 happens before BMrev so I search for a link between PP4 and BO,T1, and then, being as the EE that came inside the OOE was BMrev, I next search for a link between BM,rev and, in this scenario posted, BO,T1.
It sounds logic to me right now, until I find in the litterature or any case in a future log something that makes it sound wrong.
Attachments
Last edited:
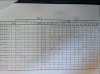
Chart & Log on 070819- part 2

It is not complete for the following reason :
On last bar of the snippet, so bar 12:15, retro backwards is activated. So on 12:00 we had already P2 and then we get :
12:05 : volume is between P2 and T1 so T2P.
12:10 : volume is between T2P and T1 so T2F.
12:15 : the close of price bar is above prior established rtl. T1 is already there in the trend. So we could have a BO,T1.
BUT
As you know, I'm currently passing from reading litterature and compiling a lot of texts that I reread AND I'm logging at least 1 session each day, sometimes like yesterday, I find myself able to produce two logs.
Recently I read this :

Myabe it's my interpretation but I understand here that if P2 is already here on the segment, then no true BO,T1 can appear. So maybe, no BO,T1 can appear. Or I'm under lack of differenciation.
This "true bo" and "false bo" reminds me when, some weeks ago, I shifted from a "not true rtl" to using "true rtl's" only.
If BO,T1 can be a true or a false one, then what ? In the same logic of "true rtl" and "not true rtl", there could be "true BO,T1" and "not true BO,T1". And thus, as no true rtl's aren't to be taken into account for a BO,T1, then no true BO,T1 couldn't be considered either.
In fact, that sounds logic to me that once P2 is there, there can't be a BO,T1, especially when I remember this (which is something I have in mind almost at any moment now) :

Once P2 is there (unless FS or any EE interrupts the completion of the trend), what comes next is non dominant leg 2 of the trend. Of course, geometrically there will be a BO of the rtl, but not really a BO,T1....like, a non true BO,T1.
Therefore, with the case I'm currently in :
I see the BO,T1 (that I labelled) on bar 12:15 as incorrect
AND
being as F-band is active after T2F AND volume is under T1 SO I see Fd EE.
New area to study for me, great
It is not complete for the following reason :
On last bar of the snippet, so bar 12:15, retro backwards is activated. So on 12:00 we had already P2 and then we get :
12:05 : volume is between P2 and T1 so T2P.
12:10 : volume is between T2P and T1 so T2F.
12:15 : the close of price bar is above prior established rtl. T1 is already there in the trend. So we could have a BO,T1.
BUT
As you know, I'm currently passing from reading litterature and compiling a lot of texts that I reread AND I'm logging at least 1 session each day, sometimes like yesterday, I find myself able to produce two logs.
Recently I read this :
Myabe it's my interpretation but I understand here that if P2 is already here on the segment, then no true BO,T1 can appear. So maybe, no BO,T1 can appear. Or I'm under lack of differenciation.
This "true bo" and "false bo" reminds me when, some weeks ago, I shifted from a "not true rtl" to using "true rtl's" only.
If BO,T1 can be a true or a false one, then what ? In the same logic of "true rtl" and "not true rtl", there could be "true BO,T1" and "not true BO,T1". And thus, as no true rtl's aren't to be taken into account for a BO,T1, then no true BO,T1 couldn't be considered either.
In fact, that sounds logic to me that once P2 is there, there can't be a BO,T1, especially when I remember this (which is something I have in mind almost at any moment now) :
Once P2 is there (unless FS or any EE interrupts the completion of the trend), what comes next is non dominant leg 2 of the trend. Of course, geometrically there will be a BO of the rtl, but not really a BO,T1....like, a non true BO,T1.
Therefore, with the case I'm currently in :
I see the BO,T1 (that I labelled) on bar 12:15 as incorrect
AND
being as F-band is active after T2F AND volume is under T1 SO I see Fd EE.
New area to study for me, great
Attachments
I'm going to mention a few things from an IRL perspective.
FS
BM stands for BOOKMARK and is used to "mark" a turn. BM's are placed on EE's and P1's, at the high or low of the bar, more specifically, at the OPPOSITE SIDE of the price movement. For instance, a turn in a down trend/segment changing to up would have a BM on the LOW of the EE or P1 being BM'ed.
BM is related to container point geometry... You are attempting to mark the container "points". The caveat is that "trends overlap" therefore each fractal, and each trend/segment has BM's, including sub-fractals! Done correctly, BM's will help you to recognize and keep focused on your trading fractal.
Back to BOT1...
Thread: butt, Post: #903
Frenchfry explains...
---------------------------------------------------------------
Quote from Jack (just in case Jack or somebody else has doubts):
"...You may only have a TRUE BO of the rtl if and only if. a T1 is there and a P2 has not appeared before (at a lock in) the BO of the rtl. If you have not annotated the P2 it has not appeared as yet just for the time being..."
Simplified: You either have a BO of a RTL or you have a BO of a RTL WITH(!) a T1.
There is further discussion on BOT1 with Jack in that thread.
FS
- FS stands for FAIL-SAFE. It is meant as a safety valve so the trader can "always" be on the money-making side of the market.
- The Failsafe VTP sheet CLEARLY states FS can be applied to ANY bar. FS is meant as a safety valve for the trader, applicable on ANY bar, therefore applicable at any time whether it be during bar formation or end-of-bar.
In the "normal" course of VTP/OOE annotating, FS has rules and/or guidelines (depending on one's POV)
- BOTI... T1 exists. P2 has not been annotated. Band A has not been established via annotation within the current segment/trend.
- BMRV... Penetration on a BM
BM stands for BOOKMARK and is used to "mark" a turn. BM's are placed on EE's and P1's, at the high or low of the bar, more specifically, at the OPPOSITE SIDE of the price movement. For instance, a turn in a down trend/segment changing to up would have a BM on the LOW of the EE or P1 being BM'ed.
BM is related to container point geometry... You are attempting to mark the container "points". The caveat is that "trends overlap" therefore each fractal, and each trend/segment has BM's, including sub-fractals! Done correctly, BM's will help you to recognize and keep focused on your trading fractal.
Back to BOT1...
Thread: butt, Post: #903
Frenchfry explains...
---------------------------------------------------------------
Quote from Jack (just in case Jack or somebody else has doubts):
"...You may only have a TRUE BO of the rtl if and only if. a T1 is there and a P2 has not appeared before (at a lock in) the BO of the rtl. If you have not annotated the P2 it has not appeared as yet just for the time being..."
Simplified: You either have a BO of a RTL or you have a BO of a RTL WITH(!) a T1.
There is further discussion on BOT1 with Jack in that thread.
I'm going to mention a few things from an IRL perspective.
FS
BM
- FS stands for FAIL-SAFE. It is meant as a safety valve so the trader can "always" be on the money-making side of the market.
- The Failsafe VTP sheet CLEARLY states FS can be applied to ANY bar. FS is meant as a safety valve for the trader, applicable on ANY bar, therefore applicable at any time whether it be during bar formation or end-of-bar.
In the "normal" course of VTP/OOE annotating, FS has rules and/or guidelines (depending on one's POV)
- BOTI... T1 exists. P2 has not been annotated. Band A has not been established via annotation within the current segment/trend.
- BMRV... Penetration on a BM
BM stands for BOOKMARK and is used to "mark" a turn. BM's are placed on EE's and P1's, at the high or low of the bar, more specifically, at the OPPOSITE SIDE of the price movement. For instance, a turn in a down trend/segment changing to up would have a BM on the LOW of the EE or P1 being BM'ed.
BM is related to container point geometry... You are attempting to mark the container "points". The caveat is that "trends overlap" therefore each fractal, and each trend/segment has BM's, including sub-fractals! Done correctly, BM's will help you to recognize and keep focused on your trading fractal.
Back to BOT1...
Thread: butt, Post: #903
Frenchfry explains...
---------------------------------------------------------------
Quote from Jack (just in case Jack or somebody else has doubts):
"...You may only have a TRUE BO of the rtl if and only if. a T1 is there and a P2 has not appeared before (at a lock in) the BO of the rtl. If you have not annotated the P2 it has not appeared as yet just for the time being..."
Simplified: You either have a BO of a RTL or you have a BO of a RTL WITH(!) a T1.
There is further discussion on BOT1 with Jack in that thread.
For that I've been building this kind of posts for a while now, I know/can perceive there is work, thinking, organization and a dose of devotion in your write up. I wanna say I appreciate it a lot and give you thanks @tiddlywinks