Hi
@Sprout,
@Simples,
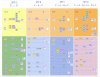
How to read the 'TP volume element ranges' in the attached?
There are columns 'Volume Element', 'Repeat (New)', 'Rev Chron (New New)', 'Next (First)', 'Kill (Suppress)' and 'Gate (Permit)'.
According to glossary, 'Repeat' is re-assignment of current volume element, 'Rev Chron' not found, 'Next' instruction to assign the next volume element in the current OOE, 'Kill' instruction to actively wait, do not allow something specific to be done even when it appears that things should proceed forward. prevents false activity, and 'Gate' instruction to allow for testing of a certain element (which element?).
Take for example P1 & T1. I'm trying to interpret it.
---
'Volume Element': P1, is pt 1 of new up/down trend
'Repeat (New)': >=, re-assign P1 if current vol bar (must it be pt1 also? or assume it's pt1 in fractal timeframe lower than 5m?) is higher than the earlier P1
'Rev Chron (New New)': >=, how to read this?
'Next (First)': Assigned, how to read this?
'Kill (Suppress)': After T1, T2P, suppress / do not annotate current vol bar as P1 if it happens after T1 or T2P
'Gate (Permit)': After P2, T2F, how to read this?
---
'Volume Element': T1, is BO of rtl of old trend
'Repeat (New)': <=, re-assign T1 if current vol bar (must it be BO of rtl also? or assume it is in fractal timeframe lower than 5m?) is lower than the earlier T1
'Rev Chron (New New)': After P1 F(ailure), how to read this?
'Next (First)': After P2 onward, how to read this?
'Kill (Suppress)': After P2 onward, how to read this?
'Gate (Permit)': None, how to read this?
My own understanding, which is incomplete: Elements follow OOE of events as described in the table from top to bottom, when permission to measure (NOT WAIT). "Next" (First) is logic for first occurence of that event. First volume element always starts from P1 assigned, nothing is seen in OOE before start of each trend. On following bar "Repeat" logic is checked. "Rev Chron" also need to be checked, if an earlier event occur again on bar n. When false, OOE progress forward according to "Next". "Kill" and "Gate" is logic for permitting or preventing certain events. P3F and P3P are for n+1 tests, though I think they make more sense when locating EE's. When Event is missing or EE, progression of trend has ended.
The logic for VTP works together with price, especially with failsafes or container BO's. Since each trend is unique, this need to be deduced through MADA to build facility and to interpret the sheets and texts concerning VTP logic as annotations.
So best bet is to try the logic out, ie. together with failsafes, learning by trial and error, and also checking old posts and charts. I prefer Jack's original posts, so as to connect directly to source and not mislead. Read as many Jack posts as possible.
EDIT: Not using Modrain. There are posts in the "butt" thread about it. I read the entire thread yesterday evening.
Thank you.
")