Making JH' SCT and all his material alive

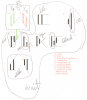
The gaussian sequence is ... B2B 2R 2B. This is a complete gaussian sequence. Once complete, only 2 things can happen with gaussian...

1) cycle indefinitely, as in... 2R 2B 2R 2B etc ... new pt3/new pt2/new pt3/new pt2/etc UNTIL BO of RTL.
2) RTL BO

Cycling is NOT required, but is often the case. Once a gaussian is complete, RTL BO is on the table, cycling or not.

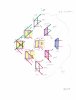
Break down a gaussian sequence B2B 2R 2B ...

B2B... Each "B" is a volume peak, with a, lets call it "unlabeled" trough in-between. In gaussian, the B2 portion of B2B is overlap.... In point terms, pt1(first B of B2B) is located in the "old" trend container, the unlabeled trough (the 2 of B2B) CAN BE in the old trend or the new but still undefined trend container, and pt2(second B of B2B) is located in the new trend container and creates the new LTL (which gives a best-guess-at-this-moment slope for RTL).

2R... pt3

2B... confirmation of pt3, completion of THIS gaussian sequence, begin cycling until or no cycling until RTL BO.

The final 2B in the gaussian is confirmation of a pt3. Another way of thinking about that is things like VE, FBO, fanning, and RTL BO can only occur AFTER a pt3 has been (properly) identified.


All of the above applies to both B2B and R2R gaussian sequences and cycling in the applicable rotation.

I had already understood all the above, and this was VERY VERY VERY nice, important and good from you and for me to have it reminded. It cleans even more things in my mind. That's a kind of "iterative strengthening"
Thanks a LOT @tiddlywinks !
 
You are doing the work, and posing better questions than anyone here! So remember all that you have, and that you're actually able to reason about this. After that, it's all iterative refinement and you have lots and lots to build from. It may even go faster!

So, P is assigned or P1 is assigned ?​

P1 won't apply to gaussians. If you want to explore gaussians, I don't think RDBMS will be too helpful, so would be better to keep the two distinct.

P here is First P1 (P1 assign.). It is volume element "P1", and the other "P1" in OOE are same (repeat) or higher in volume, but at later bars.

P is asigned and other P1's are larger than the assigned
  • Pt1 is in price ONLY. Pt1 bar-bar may be at T, IV, P or DV. Pt2 >> Pt3 >> BO are in relation to Pt1. Pt1 is start of trend / container.
  • P1/P is in the independent variable ONLY. OOE is always regarded bar-bar and when NOT WAIT. P1 may be T, IV, P or DV. Other P1's and OOE are in relation to First P1 + BM. First P1 (assigned) is start of new trend segment. BM+RTL will be visible in the price pane and BM gets assigned with first P1.
Best bet is to start OOE with P1 assigned, and do VTP from there. You have to work through it practically again and again. From VTP you find EE's. When something's amiss, you refine iteratively.
To begin, it may make sense to start on an obvious Pt1. At some point, you want to sync with price, so use FS in order to keep on the right side of the market at all times. You may want to fan, or not. FS is EE, and VTP also yields EEs, ending trend segments of RDBMS.

For differentiating T >> IV >> P >> (DV/T), probably best keep all 4 distinct, although Jack didn't differentiate T and DV in this text.. Sometimes such things are clues, othertimes types, or trolling! :p
Maybe doing drills/study on the 4 volume types will be helpful for exploring gaussians.

Got you very well. Thanks a lot for this very important contribution. All your words, either consideration and contribution, are a huge thing for me. Thank you very much for helping me with all this differenciation @Simples
 
As I see it;

B2B... = R2R... :

T-IV-P-T... =
P>dv>T<iv<P>dv...

2 = xo of RTL
B (xo of RTL) B... = R (xo of RTL) R...
2nd B, 2nd R, volume peaks correspond with price outside of prior RTL, Fan from prior pov, accelerate from new pov,

I love that
 
I've just finished to read all your 14 messages from last Saturday's night. Thank you so much for this contribution to all of you ! I need a little break of some hours, cause the last thing I'm on, which is the issue with the colors on Move Rev is bothering me a bit. Need to eat something and a little nap ;)
 
Hi All,

My self intro:
I use PA to trade. So far the result is not consistent.
I think the problem is with me, not the method.
Many times I'm not able to measure the right 'probability' to ensure the would-be trade be profitable. Other times I'm not sure whether to enter the trade and how far stop loss to place. Small stop loss can get whipped. A big stop loss may survive, but one hit can take all profit and more.

I read in ET somewhere, JHM can take the full market offer.
That means the winning probability should be higher than PA (40-60%).
So I'm seeking help from JHM experts here in my journey to learn JHM. :D

English is not my native. Please apologize if I understand slow or misunderstood you or be misunderstood. I'm now in GMT+8, my hometown in GMT+9.
So please bear with me. Joining this forum should also help me improving my English. :)

As English is not my native, and my background is in IT, actually I prefer to use excel/mathematics formula to explain things. It's more universal, readable, and understandable to most.
I find long descriptive text sometimes can be hard to digest and understand.

Thank you.

To be continued.
 
Last edited:
I want to start the journey by doing MADA logging.

There are few columns in the MADA log: Time, Bar, Turn Type, From, To, Price Case, DeGap, Arrows UL, Volume Test P1, T1, P2, T2P, T2F, BM, Additional Notes, Event, Retro, Trend Type, EE, Action.

Please help advise me if my understanding below is incorrect.

'Time' refers to starting time to ending time, based on 5min chart of ES emini.

'Bar' is counter starting from 1 till end of the regular trading hour.

'Turn Type', possible values are 'A', 'B', 'C'. 'A' is for a move from Dominance(D in short) to non-Dominance(nD in short), 'B' nD to D, and 'C' D to D. Dominance/non-Dominance can be observed by comparing bars in Volume Pane. ==> Question: how to determine it exactly? is it only by comparing V.0 (current volume bar) with V.-1 (current volume bar - 1)?
'From' and 'To' refers to the from and to dominance/non-dominance move of 'Turn Type' column.

'Price Case' refers to 10 price cases:
1) XB (Translation Black/Long),
few ways to explain it:
i. H.0>H.-1 and L.0>L.-1, translated to High of current bar is greater than High of previous bar and Low of current bar is greater than Low of previous bar, or
ii. HH HL, higher high higher low, or
iii. H.-1<H.0 and L.-1<L.0, High of previous bar is less than High of current bar and Low of previous bar is less than Low of current bar.

2) XR (Translation Red/Short),
i. H.0<H.-1 and L.0<L.-1, or
ii. LH LL, lower high lower low

3) Hitch,
i. H.0=H.-1 and L.0=L.-1

4) OB (Outside Bar),
i. H.0<H.-1 and L.0>L.-1, or
ii. HH LL

5) FTP (Flat Top Pennant),
i. H.0=H.-1 and L.0>L.-1

6) FBP (Flat Bottom Pennant),
i. H.0<H.-1 and L.0=L.-1

7) Sym,
i. H.0<H.-1 and L.0>L.-1, or
ii. HL LH, higher low lower high, or
iii. H.-1>H.0 and L.-1<L.0

8) Lateral,
i. H.0>H.n and L.0<L.n, n is 1,2,etc

9) Stitch Long/Black,
i. H.0>H.-1 and L.0=L.-1

10) Stitch Short/Red,
i. H.0=H.-1 and L.0<L.-1

Attached are price cases found in ET.

Thank you.

To be continued.
 

Attachments

  • jh Simples-ten cases-debrief.jpg
    jh Simples-ten cases-debrief.jpg
    522 KB · Views: 19
  • jh price cases Jack's picture 004 the cases.png
    jh price cases Jack's picture 004 the cases.png
    58.2 KB · Views: 19
Back
Top