A bit of DD's I'm veryfing
1- the timeframe used for monitoring is the 5min one, for trading it's the 15min one
2- when on the 5min, one must build each and every FFs created, each being part of one of the TFs also built, with themselves being a part of one of the SFs created. Everything that is "created" is drawn.
3- One must
Keep in mind that B2B(2R2B)+ and R2R(2B2R)+ can't break the container. So if price go beyond pt1 you've got something else just before that.
-> the container : what does precisely
container mean here ? following previous steps, I'd say when on a timeframe one sees for ex a B2B (2R2B)+ then, one HAVE A CONTAINER CREATED, and that is unique. I'll come back to this later when
* appear.
->
pt1 : same question here. Following previous step (FPS) one more time, it can only mean the pt1 of the
container.
As the container cannot be broken by those three moves M1 M2 M3 (going B2B2R2B for ex) AND as ftt is the moment when price coming from its RTL interrupts its journey towards LTL, reverses and begins to go back to its RTL, and during that journey back to the RTL, the SAME NON DOM Trend as it was INITIALLY supported by a down volume
curb, suddenly begins to be escorted by an increasing volume curb.
As the container cannot be broken by those three moves = B2B 2R 2B+ = 1 container
something else just before = ftt
INITIALLY supported by a down volume
curb, suddenly begins to be escorted by an increasing volume curb. = R2R or B2B and with
curb = Gaussian
4- Following previous steps (FPS) and adding 1- 2- and 3- I come to DD that when I see a B2B 2R 2B for example, there's only one container that can appear. The logical sequence is that this container is made of 4 points : pt1, pt2, pt3 and last point "to the trend".
Price's journey from pt1 to pt2 is defined by B2B (in this ex) volume gaussian move (like M1 defines first dom move in any trend), from pt2 to pt3 (so M2, non dom move) it'd be here 2R, then from pt3 to the trend being given by 2B, so back to dominance and apparition of the
container.
* remember ?  , let's go ahead.
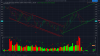
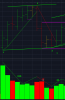
If I take my chart, and watch the direct application of this I get to the attached pic (1).
The leftmost bar is bar 1.
-> on bar1, bar2 and bar3, absolute certitude volume is continuously decreasing, passing thirdly from long to short sentiment. Would that third red bar be quite a Doji bar and an IBGS ? We have two XB in a row. Bar 3 creates a long tape. let's see if we include next bar.(@Sprout , you know what I'm remembering now.....)
-> on bar 4, we get StB, volume continues to decrease, sentiment's back to long, I include this bar4 into previous tape.
-> bar 5, new XB, volume keeps on decreasing, included
-> bar 6, another XB, volume is now dominant. Into the same tape (so one-part-trend), volume passed from non to dominant same color : we have B2B. bar 6 is included.
-> bar 7, not perfectly perceptible here but we're on a FTP so pre-Lat activated, sentiment's still long, volume returns to no dominance. WMCN a B2B ? -> 2R. Is it the case on bar 7 ? No, color is black (green here). But maybe here begins the necessity of being less rigid ? I mean FTP is less powerful than XB in a XB. In terms of impact, FTP blocks more price than it pushes it upwards. XB pushes price upwards. That's a first indication B2B is maybe not finished or 2R did maybe already begin but is not visible, only perceptible. By collecting infos. In addition to the FTP impact on long trends, I mean what it may mean, I see on bar 7 that leg 1 is longer than the two others, which is inside the bar itself an indication of counterpower for the final sentiment of the bar. Anyway, bar 7 would be included, and B2B still unlocked.
bar 8 -> StR, , Volume increases, price crosses the tape, sentiment is short, leg 2 is the longest. So bar 8 cannot be included. FTP + STR on UU volume, makes a new Pt1 with BM and a new tape's beginning.
bar 9 -> volume keeps on increasing, XR waiting for the tape to be defined.
bar 10 -> StB so pre-Lat, volume decreases, it creates the short tape, sentiment is long (new IBGS ?), included bar. This time, volume decreases. Technically it has just began to decrease, but if I see the volume point lining up with pt1 of the short tape, I can see Volume is going under the level it was primarily increasing from. In other words, if here is where one is to be less rigid and see a down curb, it's bnow clearly ok.
bar 11 -> StB, Lateral created, volumes decreases still, 2R has not ended yet, bar included.
Bar 12-> XB, volume is back to dominance, sentiment is long, tape is crossed, bar not included
Bars 13, 14 -> same as Bar 12 + we have long tape created, 2B is there, we have the whole locked Gaussian sequence of B2B, 2R, 2B. So we have ? a Container.
5- FPS, from Bar 1 to Bar 7 volume defines B2B, then price journey from point1 to pt2, from bar 8 to bar 11 volume reveals 2R with a down curb, and from Bar 11 to bar 13 volume shows 2B and we're from pt3 to the trend. So we have B2B = pt1 -> pt2 = Bar1 to Bar 7 = M1= 1 tape.
Then we have 2R = pt2 -> pt3 = Bar 8 to bar 11 = M2 = another tape.
After we have 2B = pt3 -> to the trend = Bar 11 to bar 13 = M3 = another tape
So between bar 1 and bar 13 we have 3 moves, three tapes = 3 FF = 1 TF.
6- Problems begin when we consider container as any channel built on any number of bars in a row.
If B2B 2R2B or R2R 2B2R cant' break the container, and that no trend can end before the volume sequence is locked, on any fractal, then it comes back to @Sprout 's interpretation of go beyond when viewed on a singular timeframe. That's what I'm gonna logically try to solve in my next DD posts.