Making JH' SCT and all his material alive

A bit of DD's I'm veryfing

1- the timeframe used for monitoring is the 5min one, for trading it's the 15min one

2- when on the 5min, one must build each and every FFs created, each being part of one of the TFs also built, with themselves being a part of one of the SFs created. Everything that is "created" is drawn.

3- One must Keep in mind that B2B(2R2B)+ and R2R(2B2R)+ can't break the container. So if price go beyond pt1 you've got something else just before that.

-> the container :
what does precisely container mean here ? following previous steps, I'd say when on a timeframe one sees for ex a B2B (2R2B)+ then, one HAVE A CONTAINER CREATED, and that is unique. I'll come back to this later when * appear.

-> pt1 : same question here. Following previous step (FPS) one more time, it can only mean the pt1 of the container.
As the container cannot be broken by those three moves M1 M2 M3 (going B2B2R2B for ex) AND as ftt is the moment when price coming from its RTL interrupts its journey towards LTL, reverses and begins to go back to its RTL, and during that journey back to the RTL, the SAME NON DOM Trend as it was INITIALLY supported by a down volume curb, suddenly begins to be escorted by an increasing volume curb.

As the container cannot be broken by those three moves = B2B 2R 2B+ = 1 container

something else just before = ftt

INITIALLY supported by a down volume curb, suddenly begins to be escorted by an increasing volume curb. = R2R or B2B and with curb = Gaussian


4- Following previous steps (FPS) and adding 1- 2- and 3- I come to DD that when I see a B2B 2R 2B for example, there's only one container that can appear. The logical sequence is that this container is made of 4 points : pt1, pt2, pt3 and last point "to the trend".
Price's journey from pt1 to pt2 is defined by B2B (in this ex) volume gaussian move (like M1 defines first dom move in any trend), from pt2 to pt3 (so M2, non dom move) it'd be here 2R, then from pt3 to the trend being given by 2B, so back to dominance and apparition of the container.
* remember ? :), let's go ahead.
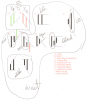
If I take my chart, and watch the direct application of this I get to the attached pic (1).
The leftmost bar is bar 1.
-> on bar1, bar2 and bar3, absolute certitude volume is continuously decreasing, passing thirdly from long to short sentiment. Would that third red bar be quite a Doji bar and an IBGS ? We have two XB in a row. Bar 3 creates a long tape. let's see if we include next bar.(@Sprout , you know what I'm remembering now.....)
-> on bar 4, we get StB, volume continues to decrease, sentiment's back to long, I include this bar4 into previous tape.
-> bar 5, new XB, volume keeps on decreasing, included
-> bar 6, another XB, volume is now dominant. Into the same tape (so one-part-trend), volume passed from non to dominant same color : we have B2B. bar 6 is included.
-> bar 7, not perfectly perceptible here but we're on a FTP so pre-Lat activated, sentiment's still long, volume returns to no dominance. WMCN a B2B ? -> 2R. Is it the case on bar 7 ? No, color is black (green here). But maybe here begins the necessity of being less rigid ? I mean FTP is less powerful than XB in a XB. In terms of impact, FTP blocks more price than it pushes it upwards. XB pushes price upwards. That's a first indication B2B is maybe not finished or 2R did maybe already begin but is not visible, only perceptible. By collecting infos. In addition to the FTP impact on long trends, I mean what it may mean, I see on bar 7 that leg 1 is longer than the two others, which is inside the bar itself an indication of counterpower for the final sentiment of the bar. Anyway, bar 7 would be included, and B2B still unlocked.
bar 8 -> StR, , Volume increases, price crosses the tape, sentiment is short, leg 2 is the longest. So bar 8 cannot be included. FTP + STR on UU volume, makes a new Pt1 with BM and a new tape's beginning.
bar 9 -> volume keeps on increasing, XR waiting for the tape to be defined.
bar 10 -> StB so pre-Lat, volume decreases, it creates the short tape, sentiment is long (new IBGS ?), included bar. This time, volume decreases. Technically it has just began to decrease, but if I see the volume point lining up with pt1 of the short tape, I can see Volume is going under the level it was primarily increasing from. In other words, if here is where one is to be less rigid and see a down curb, it's bnow clearly ok.
bar 11 -> StB, Lateral created, volumes decreases still, 2R has not ended yet, bar included.
Bar 12-> XB, volume is back to dominance, sentiment is long, tape is crossed, bar not included
Bars 13, 14 -> same as Bar 12 + we have long tape created, 2B is there, we have the whole locked Gaussian sequence of B2B, 2R, 2B. So we have ? a Container.


5- FPS, from Bar 1 to Bar 7 volume defines B2B, then price journey from point1 to pt2, from bar 8 to bar 11 volume reveals 2R with a down curb, and from Bar 11 to bar 13 volume shows 2B and we're from pt3 to the trend. So we have B2B = pt1 -> pt2 = Bar1 to Bar 7 = M1= 1 tape.
Then we have 2R = pt2 -> pt3 = Bar 8 to bar 11 = M2 = another tape.
After we have 2B = pt3 -> to the trend = Bar 11 to bar 13 = M3 = another tape

So between bar 1 and bar 13 we have 3 moves, three tapes = 3 FF = 1 TF.

6- Problems begin when we consider container as any channel built on any number of bars in a row.
If B2B 2R2B or R2R 2B2R cant' break the container, and that no trend can end before the volume sequence is locked, on any fractal, then it comes back to @Sprout 's interpretation of go beyond when viewed on a singular timeframe. That's what I'm gonna logically try to solve in my next DD posts.

In this concrete example, Pt1-2-3 seems to be a valid container still. If price "Pt3" were to violate Pt1 with BM Rev, you probably have "something else" to the left.

When annotating many bars, you get to see what fits best. Context on same fractal I think is more important than faster TF, though you'll perhaps gain clarity on faster TF as well. Certainly, you'll be provided more bars for the same period.

If trading the diagram, which side (black vs red) seems dominant?
 
Last edited:
-> the container : what does precisely container mean here ? following previous steps, I'd say when on a timeframe one sees for ex a B2B (2R2B)+ then, one HAVE A CONTAINER CREATED, and that is unique.

Page 85 from "Channels For Building Wealth v2.2" by John T. Hershey (Jack).
Widely available in several threads.

container.jpg


NOTE WELL: No mention of FTT. Compare to a complete volume sequence R2R2B2R or B2B2R2B, which does include a completion, widely referred to as FTT.

B2B 2R (or R2R 2B) pt1 -> pt2 -> pt3 define a container.


Page 99 from "Channels For Building Wealth v2.2" by John T. Hershey (Jack).
Widely available in several threads.

1B2.jpg


HTH
 
A bit of DD's I'm veryfing

1- the timeframe used for monitoring is the 5min one, for trading it's the 15min one

Trading Fractals are not necessarily coupled one-to-one with Timeframes. Jack's futures method is for monitoring and trading on the 5m. The trading fractal is monitored and observed on the 5m.


2- when on the 5min, one must build each and every FFs created, each being part of one of the TFs also built, with themselves being a part of one of the SFs created. Everything that is "created" is drawn.

This is building from the basic granularity on up. A lot of the past charts posted (from Jack and others) do not have the FF's drawn. Most skip drawing the FF's because in doing so, for they come from a beginner's orientation and do not have an advanced expert's spectrum of differentiation and understanding of the velocity of money in correct cycle timing. All Jack's charts are contextual and attempt to go where a person is in their understanding, capacity, facility and ability and build from there. Some of his examples have them annotated while many do not.

To build FF's one has to start at the 10 cases of price. At times a FF is contained with a single bar - this leads one to explore IBGS.


3- One must Keep in mind that B2B(2R2B)+ and R2R(2B2R)+ can't break the container. So if price go beyond pt1 you've got something else just before that.

-> the container :
what does precisely container mean here ? following previous steps, I'd say when on a timeframe one sees for ex a B2B (2R2B)+ then, one HAVE A CONTAINER CREATED, and that is unique. I'll come back to this later when * appear.

-> pt1 : same question here. Following previous step (FPS) one more time, it can only mean the pt1 of the container.
As the container cannot be broken by those three moves M1 M2 M3 (going B2B2R2B for ex) AND as ftt is the moment when price coming from its RTL interrupts its journey towards LTL, reverses and begins to go back to its RTL, and during that journey back to the RTL, the SAME NON DOM Trend as it was INITIALLY supported by a down volume curb, suddenly begins to be escorted by an increasing volume curb.

As the container cannot be broken by those three moves = B2B 2R 2B+ = 1 container

something else just before = ftt

INITIALLY supported by a down volume curb, suddenly begins to be escorted by an increasing volume curb. = R2R or B2B and with curb = Gaussian


There are different levels of understanding about this. This also leads to confusion and requires one's own deduction to figure out. The concept of fractal jumping describes this phenomenon as one attempts to assimilate the material.
At one level of understanding what you state is true. At another level of understanding there are moments where it is false. Incomplete trends exist and cause 'noise' within a 'clean' fractal container. However an incomplete trend (usually on a faster fractal) itself can be 'clean' (going through the 3 moves of price) or interrupted by another incomplete trend. A focus point to support clearing this up is that pt2 of the current developing trend always XO the RTL of the established trend on IV. The trends I'm referring to are the FF's, which at a granular level from the 5m perspective are 1-3ish bars in length.


4- Following previous steps (FPS) and adding 1- 2- and 3- I come to DD that when I see a B2B 2R 2B for example, there's only one container that can appear. The logical sequence is that this container is made of 4 points : pt1, pt2, pt3 and last point "to the trend".
Price's journey from pt1 to pt2 is defined by B2B (in this ex) volume gaussian move (like M1 defines first dom move in any trend), from pt2 to pt3 (so M2, non dom move) it'd be here 2R, then from pt3 to the trend being given by 2B, so back to dominance and apparition of the container.

* remember ? :), let's go ahead.
If I take my chart, and watch the direct application of this I get to the attached pic (1).
The leftmost bar is bar 1.
-> on bar1, bar2 and bar3, absolute certitude volume is continuously decreasing, passing thirdly from long to short sentiment. Would that third red bar be quite a Doji bar and an IBGS ? We have two XB in a row. Bar 3 creates a long tape. let's see if we include next bar.(@Sprout , you know what I'm remembering now.....)
-> on bar 4, we get StB, volume continues to decrease, sentiment's back to long, I include this bar4 into previous tape.
-> bar 5, new XB, volume keeps on decreasing, included
-> bar 6, another XB, volume is now dominant. Into the same tape (so one-part-trend), volume passed from non to dominant same color : we have B2B. bar 6 is included.
-> bar 7, not perfectly perceptible here but we're on a FTP so pre-Lat activated, sentiment's still long, volume returns to no dominance. WMCN a B2B ? -> 2R. Is it the case on bar 7 ? No, color is black (green here). But maybe here begins the necessity of being less rigid ? I mean FTP is less powerful than XB in a XB. In terms of impact, FTP blocks more price than it pushes it upwards. XB pushes price upwards. That's a first indication B2B is maybe not finished or 2R did maybe already begin but is not visible, only perceptible. By collecting infos. In addition to the FTP impact on long trends, I mean what it may mean, I see on bar 7 that leg 1 is longer than the two others, which is inside the bar itself an indication of counterpower for the final sentiment of the bar. Anyway, bar 7 would be included, and B2B still unlocked.
bar 8 -> StR, , Volume increases, price crosses the tape, sentiment is short, leg 2 is the longest. So bar 8 cannot be included. FTP + STR on UU volume, makes a new Pt1 with BM and a new tape's beginning.
bar 9 -> volume keeps on increasing, XR waiting for the tape to be defined.
bar 10 -> StB so pre-Lat, volume decreases, it creates the short tape, sentiment is long (new IBGS ?), included bar. This time, volume decreases. Technically it has just began to decrease, but if I see the volume point lining up with pt1 of the short tape, I can see Volume is going under the level it was primarily increasing from. In other words, if here is where one is to be less rigid and see a down curb, it's bnow clearly ok.
bar 11 -> StB, Lateral created, volumes decreases still, 2R has not ended yet, bar included.
Bar 12-> XB, volume is back to dominance, sentiment is long, tape is crossed, bar not included
Bars 13, 14 -> same as Bar 12 + we have long tape created, 2B is there, we have the whole locked Gaussian sequence of B2B, 2R, 2B. So we have ? a Container.


You are beginning to reason through in your own deduction which is good. What can change your perspective is WCB your bar1 which might or might not change pt1. Another guide is that laterals always start within a dominant move, and as such are frequently the non-dom move of an established trend. Sometimes the established dominance reasserts itself and the lateral BO in the direction of trend prior to the start of the lateral. Other times the lateral itself is the overlap of two opposite trends and price BO's against the close of the entrance bar defining the lateral.


5- FPS, from Bar 1 to Bar 7 volume defines B2B, then price journey from point1 to pt2, from bar 8 to bar 11 volume reveals 2R with a down curb, and from Bar 11 to bar 13 volume shows 2B and we're from pt3 to the trend. So we have B2B = pt1 -> pt2 = Bar1 to Bar 7 = M1= 1 tape.
Then we have 2R = pt2 -> pt3 = Bar 8 to bar 11 = M2 = another tape.
After we have 2B = pt3 -> to the trend = Bar 11 to bar 13 = M3 = another tape

So between bar 1 and bar 13 we have 3 moves, three tapes = 3 FF = 1 TF.

To check your accuracy, consider if pt2 of whatever trend you are defining is on increasing volume of that trend direction.


6- Problems begin when we consider container as any channel built on any number of bars in a row.
If B2B 2R2B or R2R 2B2R cant' break the container, and that no trend can end before the volume sequence is locked, on any fractal, then it comes back to @Sprout 's interpretation of go beyond when viewed on a singular timeframe. That's what I'm gonna logically try to solve in my next DD posts.


This is where you next insight will be. Start with examining the truth of "that no trend can end before the volume sequence is locked."

Is this true in all cases?
If so, what are the examples of where it is true?
If not, what is the difference between the cases where it is true and when not?


For the sake of clarity, you are not performing the VTP of the RDBMS and instead are annotating gaussian's per SCT.

Comments within quoted text.
 
Thank you very very much @Sprout for your comments. It's helping me a lot. Huge thanks

To check your accuracy, consider if pt2 of whatever trend you are defining is on increasing volume of that trend direction.

It's the only sentence that creates dissonance to me. As I understand it, you say let's consider that on pt2 of any trend, the volume is increasing. Until here ok, and even : how can it not be so ?
Then , of that trend direction. That confuses me. What do you mean? You mean consider that on pt2 of the trend, volume is increasing in same direction of the trend ? I don' t even understand my own last sentence :/

Can you clarify please ?
 
Page 85 from "Channels For Building Wealth v2.2" by John T. Hershey (Jack).
Widely available in several threads.

View attachment 194541

NOTE WELL: No mention of FTT. Compare to a complete volume sequence R2R2B2R or B2B2R2B, which does include a completion, widely referred to as FTT.

B2B 2R (or R2R 2B) pt1 -> pt2 -> pt3 define a container.


Page 99 from "Channels For Building Wealth v2.2" by John T. Hershey (Jack).
Widely available in several threads.

View attachment 194542

HTH


That is an absolute pleasure and a very nice surprise to see you back, a huge thank you for your new contribution. Highly appreciated, it will help me for sure.
 
Thank you very very much @Sprout for your comments. It's helping me a lot. Huge thanks


It's the only sentence that creates dissonance to me. As I understand it, you say let's consider that on pt2 of any trend, the volume is increasing. Until here ok, and even : how can it not be so ?
Then , of that trend direction. That confuses me. What do you mean? You mean consider that on pt2 of the trend, volume is increasing in same direction of the trend ? I don' t even understand my own last sentence :/

Can you clarify please ?


As per tiddywinks post, a pt2 by definition is outside the previous opposite trend's RTL. It's not so when a trend has inaccurate trendlines defining it.

So for example as Simples pointed out if you are getting a pt2 on decreasing volume, most likely you are in a larger trend container defined to the left of your window. Until it breaks the RTL of this larger container on increasing volume the operating point has not changed and the ftt that one has identified will have an FBO respecting the larger RTL, thus fanning the larger container.

When it does XO this RTL on increasing volume then the operating point has changed and one is on the way to a pt2 of a newer channel. By this happening on increasing volume the new channel will go through a VE as the channel expands by the Dominant traverse going to pt2 of the newer channel. This traverse is a smaller fractal container that accelerates a new RTL of the new operating point. This smaller fractal container will have it's own ftt.

If price XO this RTL with a BO turning into a FBO on increasing volume that is the same as the Dominant traverse then a pt3 of a larger container has been defined. If this happens on increasing volume opposite the Dominant traverse, then a new operating point is presenting.
 
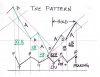
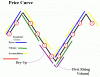
As I see that you revisit some fundamental concepts, beside mentioning "trends overlap", and "jokari window", I attached three meaningful pictures.

Also, volume bar coloring based on Jack's cases helps gaussian drawing.

Jack's picture 004 the cases.png the pattern.jpg PriceCurve.gif
 
Thank you very very much @Sprout for your comments. It's helping me a lot. Huge thanks

It's the only sentence that creates dissonance to me. As I understand it, you say let's consider that on pt2 of any trend, the volume is increasing. Until here ok, and even : how can it not be so ?
Then , of that trend direction. That confuses me. What do you mean? You mean consider that on pt2 of the trend, volume is increasing in same direction of the trend ? I don' t even understand my own last sentence :/

Can you clarify please ?

of that trend direction = new trend belonging to the pt2, which ideally happen on increasing volume and BO previous opposite trend
 
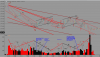
the spontaneous idea that surged in my mind today as i'm walking out and thinking about the stuff but not working concretely on it (with PC, charts, pencils, rules etc) is to debunk logically the last assertion in bold, and therefore see if it's always true, sometimes true or always false :

- we got a B2B, 2R (container is created, THANK YOU @tiddlywinks ! ), 2B, and now volume begins to decrease, price shows IBGS (if I'm ok with that @Simples ) on a XB as last price case appeared. Next bar volume decreases one more time, price shows XR. Next bar, same as prior. Next bar, volume passes from non-Dom to Dom and supports a short tape appearing with 1 bar of the last long tape (IGBS one) and the next two XR created in a row. The assertion is :
- Something crucial (ftt) resides inside the LEVEL that Volume will reach as he passes from non-Dom to Dom inside a same container. It is to be compared to something before.
 
Testing the assertion with blue commentaries, and working on it currently.
 

Attachments

  • testing the assertion.png
    testing the assertion.png
    247 KB · Views: 44
Back
Top