In the sequence that follows, I've had some little troubles as for combining absolutely everything I know that is to be on the chart.
Here is an attempt, the last one before exploring new concepts, to nest fractals. I post the charts, and the following list are the problems I've found myself with.
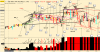
Problem 1
13:25 -> 13:40 : in this case, there's a fast fractal in dark blue appearing. I put it in blue cause it has no slope. Is that fast fractal to be drawn ? or do we fan the previous up FF ?
It does repeat between 14:40 -> 14:55.
Problem 2
16:40 -> 17:00 : here, volume does not let draw any up fast fractal until the OB appearing at 17:00 (bar 53)...to me. As I'm not sure, I put the dashed black channel to locate my problem. Is that traverse correct ? Or does it begin at 17:05 (dark full line FF) and so we fan until then ?
The same happens between 18:20 and 18:35, and between 19:45 and 20:05.
I've made my best to understand how to nest fractals..
Sprout : I've tried to add the rows on the volume pane that you talked about. I kind of feel the thing and only tried to do it on the first part of the chart, cause I'm not very sure nor comfortable with it. I understand the logic, but when in front of the bars... it's different. So I'll make an effort to understand it.
I've used kind of "the first" logic the surged in my mind as for doing that drill. I perfectly understand that row by row, going from down to up, the slopes indicating Incr/Dec reduce their number. Thing become clearer.
But my eye and the lack of logic I have with it, make me so far unable to do it nicely. I'll try it more.
As I do not know how to draw the Failsafes, I just located them from my understanding of the definition that has been given by Sprout previously.
I hope that chart is faithful to what is "waited from me", and of course I hope I finally nested properly. This was my best for today.
Problem 1-
This is in extended hours which is the low volume period of the day. This is not included in the 81bars of RTH. On your chart that starts at 15:30. 81bars gets you to 2 bars after the close to include clearing and settlement. Stop including the extended hours. The previous day's closing trend sets the stage for the following day's open. It's a logical leap to make. Even though it's a continuous market, the character is sufficiently distinct between the two to account for this dynamic. It's a different paradigm from CW and as such some of the references in CW when applied to this method look on the surface as illogical.
Problem 2-
Bar1 of the RTH is an OB.
Bar4 XB, is the speculative 1st bar of the short.
Bar6 XR, is the confirmation of the short by the XO of the RTL long.
Bar12 OB, is the third fanned pt3. This channel is now defined and one is on the lookout for the next event in the OOE.
The previous fanned trendlines are invalid after the boundary is pierced. The red channel lines drawn on bars13,14,15 are reasonable per Spydertrader, however imho, Jack would have used bar12 red pt3 as a recycled pt1 and fan from there. Jack's way would show a BO on that red trend line before Spydertrader's style. Both will get you there.
bar15 is not a red pt2. That event has already occurred for this specific channel. The next event is a ve or ftt. This bar is short of this LTL so there is the ftt of this red channel short.
This bar is the BO of the short RTL established by bar12 and bar14. This is also the pt1 of the new traverse long. We know it's still in a short channel due to the fact that volume is decreasing as price in increasing. This traverse long ends at bar17, then traverse short to include bottom leg of bar19 OB which formed the pt3 of this channel long.
This channel was formed by two FF's. The first FF was defined by bar17 causing a fanned tape. The second FF was the short tape from bar17,18,19.
Bar19 retraced over itself. First it started as a Sym (from your light gray tape) went long, reversed short, then reversed again long as it formed the OB. The artifact looks like it just went short at the open of the bar reversed at the low and closed just off it's high. This is a nuance that realtime MADA shows and not when annotating a chart off the HRE.
The low of this bar is a recycled pt1 to bar21 as pt3.
Bar23 with increasing short volume is the BO of the above RTL.
In response to
@baro-san comment, as a manner of artistic style, I've found that in using muted colors and thin lines for annotating charts allow price bars to remain Dominant in your field of vision. To test, when one squint's their eyes, the price bars should come to the forefront and the annotations should recede. The basic idea is that the market has the Dominant role and our annotations are interpretative. The goal is clarity. Generally clarity and simplicity are synonymous. At this stage it's ok to be messy.
HTH