It is
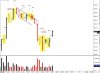
You need volume on FDAX. Find out is it volume you have on FDAX or on bets. If volume on bets no use.
You can use channel part of JHM on spreads and disregard volume.
It is
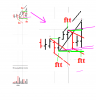
Here is a bit coarse view, doing MADA and trying to nest the three levels of fractals.
I'll soon actively post examples of my problems, post logs, and provide a nice amount of work through charts, logs, messages.
In this chart attached, I quickly focused only on nesting fractals, which is never a good thing from what I know for sure..this is why the "bit coarse view". Some annotations are skipped sometimes. This is a prelude, not a finished nor diligent work. Just wanted to keep on posting some MADA routine and exercises.
There's a couple of things. First, Jack used the ES to teach this method. The instrument that you are attempting to chart doesn't have the same kind of liquidity that the ES does. Your specific application might not work due to this liquidity issue. It appears as if most of your volume bars are under 1k in transactions. In comparison, on the ES, whenever volume dips below 2.5k, practitioners of this method are sidelined.
I don't have much knowledge on other applicable markets as for my focus is the ES.
Also, RTH is defined for your market. You should be doing MADA just on this segment and not on the extended hours. Although it is a continuous market, the character is different enough between the two to explicitly account for this. Annotate a vertical line for your start and end times.
In your first chart, fbo's on always on the RTL. They come after a pt3 has been established. The first black fbo is not an fbo. It cannot be, it's on the LTL of the short channel and a pt1 of the beginning black channel long. This pt1 is an ve and ftt of bar9. This is an early ID of an ftt, bar10 could also be considered the ftt if it was missed on the prior bar.
Match your channel colors to the OOE colors. The dark blue channel's pt2 is not an blue ftt. The blue ftt would come after a blue pt3.
If appears that you are fanning from pt3's of a channel. Spydertrader does this. Jack fans from pt1. Both can work, but I've found that Jack's way worked better for me. Once understanding the principals, one can apply how they see fit, which is what Spydertrader imho did.
The accelerated tapes look ok. When there is an accelerated tape, that is the Dominant Traverse. Acceleration always denotes Dominance.
")
With your row of volume annotations, add another row atop that uses this first base layer as the input to determine incr/decr volume. You'll use this upper row to screen for the larger peaks and troughs that occur by looking at bar clusters. Then add another row atop that.
The idea is that tracking bar-by-bar with give you the gaussians for the tapes.
Keep nesting, but once you get hit on the chin, i mean...sigh.....I`d love to see you nesting real time and real money on some huge event(which will eventually happen).
3. Annotating price on the fast fractal was done and slowly some omissions were picked up upon. The vocabulary got refined and translation finally appeared to describe the progress of price.
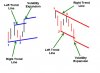
the short and long do not make a short trading fractal since the long ends too high. We throw the short aside and consider the next two (long and short. We see that the short ftt is above the first ftt, so a trading fractal is possible.
When the pink RTL is runn ftt to ftt, there is a geomtric interference and so se fan to have a geometric solution.
As a trader we could just be trading ftt to ftt and getting the job done. As we past the last ftt we went long.
The forming bar finally finishes as it went through a bunch of mutations. There were MADA laps or cycles as well and a lot of logging.
We can reverse on the post stitch BLK >>>OP top because we are doing a ve and we will or will not be in the "zone" after that.
If zone, then M1 ftt is next trade, If not zone then we are r2r in a fast Fractal. after ftt on beginning of upcoming bar.
Now we have advanced to a TWO fractal level of building. we have fast fractals and trading fractals.
Exactly the same happened with the labelling of pt1 and pt2 : at the beginning, like Jack did, I had always pt1 and pt2 on the same RTL, pt3 were to be on the LFT. Spyder does not do that.
Let's take any XB. Two black bars. They are followed by an XR, red sentiment. So three bars. On the lowest low of those three bars, which is the low of bar 1, we see a Point 1, at the highest high (which is the high of bar 2) we see a Point 2 and on the low of bar 3 we see a Point 3. So on this kind of pattern, a long channel appears clearly. At THIS level of resolution, so TWO TAPES, we can see, geometrically a Long channel going on. The close and the high of bar 3 would say if the last point to annotate was either FTT, FBO or VE.
But, what must volume do to declare « here is a FF/TF/SF ?
Question 1 : Nesting fractals properly
Question 2 : The Gaussian formations
Question 3 : Bands
Question 4 : Failsafes
Here I join this doc posted by JH.
We can see he draws a long fast fractal on three bars, with volume decreasing from pt1 to pt2 and doing trough on pt2, and increasing from pt2 to pt3.
So, the opposite of what has always been said.
And here is the explanation :
Any help would be appreciated, cause the explanation is not a concept applicable to any context, but an result of an example that is not helpful to me. At all.
I already presented kind of a context, decided to draw a fast fractal on the same situation, but I know from sure and reliable source, that it was not correct.
Why ? I only know that "it depends on what volume is doing".
I'm still searching for a simple explanation of what volume must do WHILE price is making the pattern, to be allowed to see any fractal.