
You are using an out of date browser. It may not display this or other websites correctly.
You should upgrade or use an alternative browser.
You should upgrade or use an alternative browser.
Long-term and Short-term Setups
- Thread starter TriciaWilson
- Start date
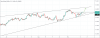

CAD/JPY Technical Analysis

- The counter has formed a head and shoulder pattern.
- It has broken the neckline with a strong bearish candle.
- We expect the neckline to cap the upswing and push it down from here.
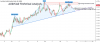
AUD/CAD Technical Analysis
~~ The counter is currently trading around a strong resistance zone that triggered a sell-off previously.
~~ According to the wave, it has now completed the ABC correction for the down move it made.
~~ Further, the entire setup looks like a head and shoulder in the higher timeframes.
~~ Hence, we expect the pair to move down from here to the potential supportive trendline marked in the chart and if it is broken, it could trigger a larger sell-off.
~~ The counter is currently trading around a strong resistance zone that triggered a sell-off previously.
~~ According to the wave, it has now completed the ABC correction for the down move it made.
~~ Further, the entire setup looks like a head and shoulder in the higher timeframes.
~~ Hence, we expect the pair to move down from here to the potential supportive trendline marked in the chart and if it is broken, it could trigger a larger sell-off.
Attachments
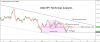
USD/JPY Technical Analysis
~~ The counter is currently in a descending channel formation.
~~ It has made an inverted and cup and handle formation within that.
~~ Further, the price is currently hovering around a strong supply zone.
~~ Hence, we expect the pair to be bearish in the short-term.
~~ The counter is currently in a descending channel formation.
~~ It has made an inverted and cup and handle formation within that.
~~ Further, the price is currently hovering around a strong supply zone.
~~ Hence, we expect the pair to be bearish in the short-term.
Attachments
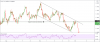

EUR/USD Technical Analysis
~~ This counter has formed a descending channel formation.
~~ It has taken the strong support as resistance & bounce back in downward direction.
~~ Hence, it will be bearish from here.
Right at this moment, there is no indication / signal to show it will go down.
BTC/USD Technical Analysis
~~ BTCUSD pair has been in the bullish movement.
~~ Now, it was consolidating @ 10894 after breaking the symmetrical triangle pattern.
~~ Hence, we are expecting that it will be rebound to the upward movement further in the near term.
~~ BTCUSD pair has been in the bullish movement.
~~ Now, it was consolidating @ 10894 after breaking the symmetrical triangle pattern.
~~ Hence, we are expecting that it will be rebound to the upward movement further in the near term.
Attachments
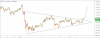
BTC/USD Technical Analysis
~~ BTCUSD pair has been in the bullish movement.
~~ Now, it was consolidating @ 10894 after breaking the symmetrical triangle pattern.
~~ Hence, we are expecting that it will be rebound to the upward movement further in the near term.
it is still moving in a small range / consolidation phase, though the day chart shows it is in the up channel.