Long-term and Short-term Setups

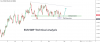
AUD/USD Technical Analysis

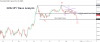
~~ As we mentioned earlier, AUD/USD has formed a gramophone pattern.
~~It has now formed an inverted head and shoulder pattern the supportive trendline and has broken out.
~~ And the RSI indicator has also replicated the same pattern, which validates the strength in the counter.
~~ Further, the prices are now trading above a strong support level of 0.71727.
~~ Hence, we expect the pair to be bullish from here on.

RL6kNGay

Why do you keep saying WE in your message post along with showing the user name on the charts as the vendor "traderpulse" ?

Also, do you trade these signal calls via simulator or real money trades ?

Will you be posting any follow-up charts with the results of the signal calls ?

wrbtrader
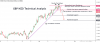
 
USD/CAD Technical Analysis

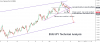
~~ The counter has been trading with a bearish bias for long.
~~ The down move can be plotted with a pitchfork and the pair is making its last leg of the move down.
~~ Hence, we advise traders to go long at the lower parallel.
~~ And the upswing has a great chance to break the upper end of the range.


qRaTJVHT
 
EUR/USD Technical Analysis

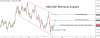
~~ The counter has made a bullish breakout from the consolidation.
~~ It is now taking support and broken resistance, which is a powerful sign.
~~ Further, the consolidation can be interpreted as wave 4 and it is gonna make a move to wave 5.
~~ Hence, we expect the pair to be bullish in the near-term

w9II0dNR
 
GBP/NZD Technical Analysis

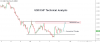
~~ The counter has formed a topping out formation in the near-term.
~~ It made a double top and has broken a key support level of 1.99508.
~~ Further, the round number of 2.00 can act as psychological barrier in the near-term.
~~ Though a pullback to the top cannot be ruled out, we still expect the pair to be bearish in the near-term.
 

Attachments

  • freeanalysis.png
    freeanalysis.png
    46.6 KB · Views: 9
Last edited:
NZD/JPY Wave Analysis

~~ The counter is currently formed a flat ABC corrective wave.
~~ It broke out from a bear flag pattern, tested the broken support, and is now coming down with strong momentum.
~~ Hence, we expect the pair to be bearish in the near-term.
 

Attachments

  • freeanalysis.png
    freeanalysis.png
    40.9 KB · Views: 8
EUR/JPY Technical Analysis

~~ The counter had multiple supports- trendline, bullish flag support and price action support.
~~ But it has broken all the levels and bulls are trapped big time.
~~ Hence, we expect some long unwinding move in the counter.
 

Attachments

  • 1598012894445.png
    1598012894445.png
    56 KB · Views: 6
NZD/USD Technical Analysis

~~ The counter is currently is descending channel pattern.
~~ It hit the lower parallel and bounced off with a ascending channel pattern.
~~ Hence, we expect the pair to trade with positive bias in the short-term.
 

Attachments

  • freeanalysissssssss.png
    freeanalysissssssss.png
    53 KB · Views: 5
USD/CHF Technical Analysis

~~ The counter is currently in sideways consolidation.
~~ It made a false breakout at the lower end of the range and has crept in and now forming a symmetrical triangle pattern.
~~ We expect the triangle to render a bullish breakout and push the price to upper end of the range for now.
 

Attachments

  • ANALYSIS.png
    ANALYSIS.png
    35.4 KB · Views: 5
EUR/GBP Technical Analysis

~~ The counter is currently consolidating in a wedge pattern.
~~ It hit the lower end of the range, formed an exhaustion candle and rose up sharply.
~~ Now, it is sliding to a demand zone where we expect buying activity to resume in the counter.
 

Attachments

  • EURGBP.png
    EURGBP.png
    40.3 KB · Views: 7
EUR/CAD Technical Analysis
  • The counter is currently sliding down in a descending channel.
  • It hit the upper parallel and is coming down strongly.
  • Further, the RSI indicator has formed a head and shoulder pattern.
  • Hence, we expect the pair to be bearish in the near-term.
analysis.png
 
Back
Top