It's been 3 years and I'm back!

Hey s0mmi. Thanks so much for all the insights and direction. I've been trading the Aussie bond markets for a little while now ever since I came across this thread. With the spreads your trading now, are these in the Bank Bill Futures? Are you also trading Eurodollars as well? It seems as though these markets don't move very much so I'd be very interested into hearing your insights into them.

babycakes

One of the whores I'm pumping is indeed the Aussie Bank Bills but not in the way you imagine. I am not a full time STIR trader. Usually you'll find the STIR traders to be full-time in reading price action and holding queue positions.

Also, it's rare to find a full-time STIR trader who pumps someone from every country. Usually they will specialize, either in Australia or America or Europe or Britain or Canada. It depends on the time-zone.

From what I hear, the Sterling is usually the best because of the hours though (and the UK is light and tight compared to Euribor of course).

If you are going to trade you have to follow the trend with whats moving... there is no inflation coming back as of yet.

If you asked me what I would do if I walked into an Australia-focused trading situation then I would do the following...

For Australia, your war station should be comprised of:

1. Short End - Bills (HBS?3, HBS?4, HBS?5, HBS?6 etc.)
The first 4 HBS = 1st year
The second 4 HBS = 2nd year

The 3-month calendars will obviously never move but you should probably do something like this;

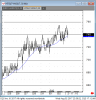
Bring up the 4th and 5th bill together on a chart to see what they've been doing over time;

Here we go;

upload_2017-8-2_23-58-14.png


You can see massive strength in Bills

2. Middle-End - 3yr Bond (HTS)

Bring up two charts for the 3yrs. One should be Bills v 3yrs, the other should be 3yrs v 10yrs Curve;

Bills 3yrs Spread

upload_2017-8-2_23-59-38.png


3yr v 10yr Curve

upload_2017-8-2_23-59-54.png


3. Long-End - 10yr Bond
(HXS)

Part of your 10-yr station will have the Aussie Curve already (from the middle section) but then you probably want to add a spread with the U.S. Tnotes because Australia's cash session is during Asia and then the over-night begins to take a beating in the ass from Bund + Tnote

upload_2017-8-3_0-1-32.png


Trading Strategy

The blueprint for the war station ends here because Australia is pretty small and only has 2 bonds. This is a positive thing not a negative, because we are a tiny piece of sh*t floating in the ocean, we are very susceptible to retracements from overseas influences. This translates to auto-fade territory most of the time.

Note: Most charts I've put at 30-minute, you should start to hone in on 5-minute charts if you want to scalp around or play around with a suitable time frame.

The time frame does not matter too much but all you need to see is the picture across the curve.

Using a set-up like this, if you are taking order flow from the Bills or 3yrs or 10yrs, at least you can see where it is relative to everything else.

I've literally p*ssed away a lot of fundamental edge in this post but it doesn't matter because if you want to work hard at this, you can. You need to go back in time and back-test your little ideas. For example you may want to see how sitting a certain distance away (0.5 bp, 1.0 bp, 2.0 bp etc.) can change your profitability over time based on leads from other parts of the curve.

If you are going to come out ahead of the game or with an STD, it will all depend on whether or not you actually went through the execution and the timing of trades that you're comfortable with. You have to consider factors like profit taking (enormous traders still take 1 bp in trades they are not sick c*nts).. and the timing perhaps of trade (at what point do you give up)... and whether or not Tier 1 news is coming out (Aussie GDP, Aussie CPI, U.S. NFP etc.)...

Once again I would stress to you, like I have said in many other posts, the juice is in high probability, low frequency trades. My 2 traders so far have been extremely successful with this mentality because I tell them only spastics think they have to go in with their fingers on the trigger every day. Volatility is telling you the exact opposite.

I hope you enjoyed this post :)
 

Attachments

  • upload_2017-8-3_0-0-15.png
    upload_2017-8-3_0-0-15.png
    25.7 KB · Views: 56
  • upload_2017-8-3_0-1-53.png
    upload_2017-8-3_0-1-53.png
    46.2 KB · Views: 52
Hey s0mmi, many thanks for being so generous with your knowledge. You are right about outrights not being easy to mean revert trade. Have you tried trading breakouts for outrights? That might be a more suitable strategy.

To make money on break-outs you need to look for consistent momentum, price-action and levels which are formed and broken pretty frequently enough to justify a strategy like this.

The VIX is really low, volatility is a$$... there is no point in wasting time on a break out strategy like this unless you have statistically tested it in some run-away markets.

If you have the tools and program available to do this, I would definitely encourage it to be done using ADL or some algo-trading (so you can look at every single market of interest instead of just one and have set risk/reward metrics).

So to scratch all this fancy talk, of the rare breed of profitable people still around, I don't know any big outright traders and especially break-out traders.... but I definitely know spreaders are still breathing...
 
You can test spreads statistically and quantify when you should bet on mean reversion. Deal to the subdued volatility in spreads as you've mentioned, you would need to bet size to make decent dough. But how do you deal with the risk when there is a break in the spread beyond levels that you have seen before?
 
You can test spreads statistically and quantify when you should bet on mean reversion. Deal to the subdued volatility in spreads as you've mentioned, you would need to bet size to make decent dough. But how do you deal with the risk when there is a break in the spread beyond levels that you have seen before?

You can't hold positions forever and expect a career to flourish. If something is painful and hits your threshold then you need to get out... that's why I strongly suggest doing back-testing to make sure the model holds up if you're taking a certain profit/loss... all according to a win rate.

I don't like giving away more than a weeks worth of trades, there are some occasions I will have to bet 2 weeks to 4 weeks worth (only a few times a year), but most of the time it is very irresponsible to give away a large chunk of wins. There are still traders that are risking 1-3 months worth, or who knows how much... if your average month has decreased by 50% over the past quarter, do you factor this into your risk appetite?

There has to be a point where you just go "this trade is not worth it anymore". Periods of low volatility, like right now, are usually met with an explosive event somewhere that wipes out the person who doesn't want to give up their trade.

Honestly, everyone says they have this pain threshold but I absolutely do not see everyone sticking to it. I have broken this rule many, many times! I guess I am lucky to still be around.

The best way to overcome this is to have a wide array of trades that you strongly feel are higher probability, so that when you take them, you are usually in a good price or level anyway and you aren't at the mercy of being scared that things will keep going and going..
 
My 2c on outrights. If you are point and click you need to isolate a certain condition and only study price or even consider a trade when your conditions are met. This is really hard to do psychologically as the trader is drawn to what he thinks are 'opportunities' but he ends up losing. The problem is magnified if the trader is undercapitalised as they naturally want to do more spins as a single sensibly sized trade every day / few days / week is not enough to make s living. It took me years to be able to not trade for a whole day or even a whole week sometimes.

Examples of conditions to study could be confirmed range bound or a set move from the open and back through the open within a longer term trend. Even a simple study of dip buying price action in confirmed trends is def possible.


Hey babe.

I cannot overstate just how much junk, filth and False Prophets there are in this industry. And the prop firm situation along with dead volatility in Australia is absolutely no exception to this.

A lot of traders I know of are simply surviving because of their bankroll built up between 2008 to 2015 (depending on when they started). Along with this bankroll came size, limits, and a lot just rely on the rebate scheme (from the SFE).

I am not in this pool by the way so I am not winging it or on my last legs anymore. If you want a healthy career that has longevity you should never ever rely on the rebates from exchange or you're a sitting duck waiting to blow out.

As for trading other products in Asia:

When it comes to Outright trading I want you to be aware of something. The "Outright" world you used to know of is almost entirely gone. The point-and-click dream traders of the past are almost all gone (and back then, they were already a rare breed). They were trading based off easy-to-read price-action and fluid movement, large orders/spikes appearing, momentum moves and correlation in play (e.g. if the Aussie dollar was down 50 ticks in the middle of the day, the Aussie SPI and the HSI and the Nikkei would most likely allow you to get short and scalp around)

This is important as a contrast to today. You have dwindled volatility and you have a 'factor market', all the algorithms are in there doing correlation trades and going off the same principals of research.

Most of the winning rates from Outright trades will hover between 50% up to 70% (just a rough guess). So you definitely need to have an understanding of this and the profit v risk metrics just to get ahead.

If you are going to trade the Nikkei and HSI and anything else you need to know that it's not enough to just go in blind anymore.

The only Nikkei trader I used to know of, started in 2010, and quit in 2015 I believe. Eventually, the inconsistency of returns and the pain of the swings (on a weekly and monthly and quarter scale) just become too over-bearing.

I wish I could bring you more great news...

If there are outright traders right now they are probably in the form of either the 1 or 2 guys left with 50,000 indicators on their screen and levels everywhere... or a group of traders with ADL who have statistically backed research and coded their rules to execute trades

I have to stress this once again...

what I am doing to be successful is to do LOW frequency HIGH probability trades.

It's not enough to just commit to a few products or spreads. I really do recommend looking for the same 'setup' across as many indices or products as you can. This isn't a holy grail but its most definitely the absolute difference I see between profitable + efficient accounts versus the primitive one-dimensional traders trying to salvage a career
 
Hi Sommi, nice thread.

Over trading has always been a problem for me. I was wondering - when you say low-frequency trades, what does that actually mean? Like 10 trades a day? 1 a day? 1 a week?
 
@s0mmi, what are the ratios for bills-3yr and 3-10yr? Would you price it 2:1 and 2.5:1? Or would I be bending myself over this way?

EDIT. I just realized bills and also the 10yr are 10k underlying and 3yr is 1k... so technically trade it 2:10 and 25:1?
 
Last edited:
Hi Sommi, nice thread.

Over trading has always been a problem for me. I was wondering - when you say low-frequency trades, what does that actually mean? Like 10 trades a day? 1 a day? 1 a week?

Over-Trading means you don't know what you're doing. Recognizing this is the first step to climbing the mountain. You need to get to the point where I am; I can tell you what a Good Trade vs. a Bad Trade would be (using my own system) and I don't have to show you any Profit/Loss because it's irrelevant. You can't control what the market is going to do (FuturesTrader71 talks about this a lot), all you can do is execute your plan. Over-Trading means you're taking trades not in your plan, which is equivalent to a Boxer who is throwing punches in the air when the opponent is 2 meters away from him.

Most d*ckheads will just stop their advice right here and say "you need to do more research" or "you need more confidence". What does this all mean? It's usually a bunch of generic, vague advice from some flop who doesn't want to help you, or is trying to sell you some garbage trading course.

"Confidence" will directly come from results. Let me guide you through an expansion of my previous post.

High probability, Low Frequency

What I mean by this is, if you grab an excel sheet and some charts and visually go through for 2015, 2016, 2017, you should find some basic patterns that pop up in some markets.

Trust me, I wanted to specialise in one or two spreads but I have found this is not enough for a human trader because there is not enough profit-spikes in this low volatility environment.

The number of trades is completely arbitrary. First you need to start with a fundamental system that lets you gauge value. This is why trading is very hard... you see there is nothing I can tell you that is concrete. But here's a basic one I've pulled out of my a$$ right now;

Product: Aussie 10yr vs. U.S. T-Note spread
(CQG Code: HXS-0.130*TYA)

Hedging ratio is DV01 netural.

Value system 1: A simple Moving Average Cross Over. Remember, the product does not even matter. You can apply this to literally anything. This has not been back-tested, this is your job. You need to go back in time for 2015, 2016, 2017 and see how these 'values' may change according to the volatility of the time.

Here is what the chart looks like and here are the settings on a 3-minute chart for scalping:

upload_2017-8-3_15-5-15.png


Here are my settings:
upload_2017-8-3_15-5-33.png


Period 20, 100, 200 (Blue, Red, Green)

Trading Value

I'll zoom into one occasion (2nd August, 2017):

upload_2017-8-3_15-7-10.png


You just need to keep it basic. Your Green Line is your fat moving average. Whenever the product is below your big fat green line, you want to be short. How much you want to sell, and how much profit, and all that risk-metric stuff must be researched by you.

If I was using this system, I would be short as long as the product stays below the green line. I'm being told it's a sign of weakness and I'm going to stay in as long as my system tells me I need to. Now, for profit, I wouldn't get too excited, taking between 1 and 2 XT ticks (0.5bp to 1.0bp) is plenty.


Value system 2: A basic bollinger band (2nd STDEV and 3rd STDEV). All you need to do is simply test Bollinger bands with different periods, according to some changes in your parameters, and go through history and see how your risk/reward plays out. Touches the bottom, buy. Touches the top, sell. This is a very No-Frills system of course.

upload_2017-8-3_15-17-13.png


Tweaking

Don't be fooled by this foundation. You will be very surprised how well the most simple systems work. The less discretion for you, the better.

Now, where does High Probability/Low Frequency come into play? Well, if you use my settings and go back through time you probably find that after 3-6 months of data that maybe your win rate is something like 65-70% (worst case) up to 80% (best case) and you need to risk ~3.5-4.0 in order to profit 1 to 2.

Perhaps this isn't good enough for you, so you might change the Moving Average parameters and the Bollinger Band and now suddenly you are going to be moving yourself into win rates of 75-80% up to 90-95% for certain months/quarters.

Transferring this across products

As you get the better win rates of the past you'll find yourself dry. I can't even count the amount of 15-hour sessions I've done on Saturdays and Sundays, sitting on the charts by myself, with my phone on silent, just plugging away and looking at this. If you are not up for doing this, then the next person will be.

As soon as you play with these things settings on the Aussie 10/10 spread, you can now start to look at others and literally apply the same foundation (but with obviously tweaked parameters).

Examples:
* Aussie 3yr-10yr spread
* USA FYT Spread
* USA NOB Spread
* German Bund v Buxl Spread
* U.S Tnote vs. German Bund Spread

And so on.

Remember, you need to do your own research (I've said this a billion times) and you need to not take any short cuts. Some spreads have wider duration and are hence more prone to direction (hint: the BUND!)

And note, sometimes your 'system' might just need to change from a 3-minute to a 10-minute chart and suddenly you've taken a losing one into something with 70-80% win rate (but only 1/4 of the trades).

Changing Over Time

The hardest part comes now... over time you need to change your settings. Volatility will move around, and Tier 1 data will come out so you need to make sure you're happy with the risk appetite coming up.

Also, don't forget, maybe you're happy risking $1,000 on the Moving Average product but only $350 on the Bollinger-Band value system because of its inherent 'fading' nature.

I've thrown a lot of principals out there, but now you can see that there is no such thing as "Over Trading" when you construct your own war station that tells you what to do.
 
@s0mmi, what are the ratios for bills-3yr and 3-10yr? Would you price it 2:1 and 2.5:1? Or would I be bending myself over this way?

EDIT. I just realized bills and also the 10yr are 10k underlying and 3yr is 1k... so technically trade it 2:10 and 25:1?

The ratios are found in the exchange ladder...

www.asx.com.au/documents/products/asx-24-futures-and-options-calculator.xls

Bills, 3yrs, 10yrs, all have the same pricing mechanism (1 basis point moves, 10bp in a Point)

Bills = $24/tick (1 basis point increment
3yrs = $30/tick (1 basis point increment)
10yrs = $50.50/tick = $101 for 1bp increment

Bills/3yr ratio = 30/24 = 1.25 times more bills needed = 20 IR (bills) to 16 YT (3yr)
3yr/10yr ratio = 101/30 = 3.33 times more 3yrs needed = 33 YT (3yr) to 10 XT (10yr)


The entire aussie yield box curve:

What you'll want to do is match the 3yr Leg, so let's double the increment of the Bills/3yrs from (20:16) to (40:32) because we get 32 three years here and its close to 33 YT needed in the Aussie Curve

Final approximate ratio of the box curve:
40 Bills, 65 3yrs, 10 10yrs

CQG code:
(HBS?4-HTS)-(HTS-HXS)

Make sure there's no continuation charted
 
I hope you enjoyed this post :)

Thank you.

One thing I got stuck on was tick value for these spreads, as I wasn't sure if the quick pullbacks would slowly wipe me out, so I defaulted back to the bund again.

Product: Aussie 10yr vs. U.S. T-Note spread
(CQG Code: HXS-0.130*TYA)

Hedging ratio is DV01 netural.

Here is what the chart looks like and here are the settings on a 3-minute chart for scalping:

View attachment 176318

For your above chart with Aussie 10yr vs US T note, how do you work out the tick value in $USD, or the $ value between each of those solid grid lines on the chart?
 
Back
Top