You are using an out of date browser. It may not display this or other websites correctly.
You should upgrade or use an alternative browser.
You should upgrade or use an alternative browser.
It's been 3 years and I'm back!
- Thread starter s0mmi
- Start date
Thank you.
One thing I got stuck on was tick value for these spreads, as I wasn't sure if the quick pullbacks would slowly wipe me out, so I defaulted back to the bund again.
For your above chart with Aussie 10yr vs US T note, how do you work out the tick value in $USD, or the $ value between each of those solid grid lines on the chart?
Here's a trick I can show you.
Right click on the chart, Pointer tools, Currency:
CQG can automatically use the tick-values to tell you the dollar value of the distance traveled.
When you select Currency, draw a line from from 80.940 to 80.930;
Notice the little number 104.20 this is actually using Aussie dollar. So you know a distance of one bar gets you ~$104
We know the tick-value of the 10yr bond is ~$51 (DV01 = $101) so we know roughly a bar on the chart is about 1 basis point
Attachments
I just love this post...well said s0mmi! I've been doing "high probability/low frequency" trades with treasuries-gold-natural gas for many many years now, it's the only way in my opinion. Traders like Buy1Sell2 will never believe a post like this...whatever. I can tell s0mmi has legit knowledge in the trading game...listen up newbies! I especially like "volatility will move around"...I've had to become a volatility specialist over the years to stay in the game.Over-Trading means you don't know what you're doing. Recognizing this is the first step to climbing the mountain. You need to get to the point where I am; I can tell you what a Good Trade vs. a Bad Trade would be (using my own system) and I don't have to show you any Profit/Loss because it's irrelevant. You can't control what the market is going to do (FuturesTrader71 talks about this a lot), all you can do is execute your plan. Over-Trading means you're taking trades not in your plan, which is equivalent to a Boxer who is throwing punches in the air when the opponent is 2 meters away from him.
Most d*ckheads will just stop their advice right here and say "you need to do more research" or "you need more confidence". What does this all mean? It's usually a bunch of generic, vague advice from some flop who doesn't want to help you, or is trying to sell you some garbage trading course.
"Confidence" will directly come from results. Let me guide you through an expansion of my previous post.
High probability, Low Frequency
What I mean by this is, if you grab an excel sheet and some charts and visually go through for 2015, 2016, 2017, you should find some basic patterns that pop up in some markets.
Trust me, I wanted to specialise in one or two spreads but I have found this is not enough for a human trader because there is not enough profit-spikes in this low volatility environment.
The number of trades is completely arbitrary. First you need to start with a fundamental system that lets you gauge value. This is why trading is very hard... you see there is nothing I can tell you that is concrete. But here's a basic one I've pulled out of my a$$ right now;
Product: Aussie 10yr vs. U.S. T-Note spread
(CQG Code: HXS-0.130*TYA)
Hedging ratio is DV01 netural.
Value system 1: A simple Moving Average Cross Over. Remember, the product does not even matter. You can apply this to literally anything. This has not been back-tested, this is your job. You need to go back in time for 2015, 2016, 2017 and see how these 'values' may change according to the volatility of the time.
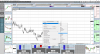
Here is what the chart looks like and here are the settings on a 3-minute chart for scalping:
View attachment 176318
Here are my settings:
View attachment 176319
Period 20, 100, 200 (Blue, Red, Green)
Trading Value
I'll zoom into one occasion (2nd August, 2017):
View attachment 176320
You just need to keep it basic. Your Green Line is your fat moving average. Whenever the product is below your big fat green line, you want to be short. How much you want to sell, and how much profit, and all that risk-metric stuff must be researched by you.
If I was using this system, I would be short as long as the product stays below the green line. I'm being told it's a sign of weakness and I'm going to stay in as long as my system tells me I need to. Now, for profit, I wouldn't get too excited, taking between 1 and 2 XT ticks (0.5bp to 1.0bp) is plenty.
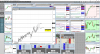
Value system 2: A basic bollinger band (2nd STDEV and 3rd STDEV). All you need to do is simply test Bollinger bands with different periods, according to some changes in your parameters, and go through history and see how your risk/reward plays out. Touches the bottom, buy. Touches the top, sell. This is a very No-Frills system of course.
View attachment 176322
Tweaking
Don't be fooled by this foundation. You will be very surprised how well the most simple systems work. The less discretion for you, the better.
Now, where does High Probability/Low Frequency come into play? Well, if you use my settings and go back through time you probably find that after 3-6 months of data that maybe your win rate is something like 65-70% (worst case) up to 80% (best case) and you need to risk ~3.5-4.0 in order to profit 1 to 2.
Perhaps this isn't good enough for you, so you might change the Moving Average parameters and the Bollinger Band and now suddenly you are going to be moving yourself into win rates of 75-80% up to 90-95% for certain months/quarters.
Transferring this across products
As you get the better win rates of the past you'll find yourself dry. I can't even count the amount of 15-hour sessions I've done on Saturdays and Sundays, sitting on the charts by myself, with my phone on silent, just plugging away and looking at this. If you are not up for doing this, then the next person will be.
As soon as you play with these things settings on the Aussie 10/10 spread, you can now start to look at others and literally apply the same foundation (but with obviously tweaked parameters).
Examples:
* Aussie 3yr-10yr spread
* USA FYT Spread
* USA NOB Spread
* German Bund v Buxl Spread
* U.S Tnote vs. German Bund Spread
And so on.
Remember, you need to do your own research (I've said this a billion times) and you need to not take any short cuts. Some spreads have wider duration and are hence more prone to direction (hint: the BUND!)
And note, sometimes your 'system' might just need to change from a 3-minute to a 10-minute chart and suddenly you've taken a losing one into something with 70-80% win rate (but only 1/4 of the trades).
Changing Over Time
The hardest part comes now... over time you need to change your settings. Volatility will move around, and Tier 1 data will come out so you need to make sure you're happy with the risk appetite coming up.
Also, don't forget, maybe you're happy risking $1,000 on the Moving Average product but only $350 on the Bollinger-Band value system because of its inherent 'fading' nature.
I've thrown a lot of principals out there, but now you can see that there is no such thing as "Over Trading" when you construct your own war station that tells you what to do.
Last edited:
I just love this post...well said s0mmi! I've been doing "high probability/low frequency" trades with treasuries-gold-natural gas for many many years now, it's the only way in my opinion. Traders like Buy1Sell2 will never believe a post like this...whatever. I can tell s0mmi has legit knowledge in the trading game...listen up newbies! I especially like "volatility will move around"...I've had to become a volatility specialist over the years to stay in the game.
You only know what YOU know!
Trying to preach to others as if bond trading is the only way to make money..well..shows exactly what you really know
")
Have you ever heard of "the unknown unknowns" !
Bond trading definitely isn't the only way to make money. My point was high probability/low frequency trading is the best approach...in my opinion. Whatever instrument works best...I think nat.gas is the best volatility out there. Sure, there are profitable traders in every kind of style out there, but I would only teach high probability/low frequency trading to people I care about.You only know what YOU know!
Trying to preach to others as if bond trading is the only way to make money..well..shows exactly what you really know
Have you ever heard of "the unknown unknowns" !
Bond trading definitely isn't the only way to make money. My point was high probability/low frequency trading is the best approach...in my opinion. Whatever instrument works best...I think nat.gas is the best volatility out there. Sure, there are profitable traders in every kind of style out there, but I would only teach high probability/low frequency trading to people I care about.
Ok..fair reply..can you briefly explain how high probability is linked to volatility..as by its nature.. volatility implies higher risk and possible large drawdowns if trades are held for a prolonged period..maybe I am picking you up wrong..but you can easily put me right.
I'm strictly a day trader (except for retirement investments) that would classify myself as a swing scalper. The highest probability setups need enough movement to make an entry worthwhile...nat.gas is best for me. Basically, I need a certain degree of that movement happening. I agree, prolonged holding periods combined with higher volatility increases risk, but not necessarily for day trading. I'm not a breakout trader (at least not purposely) or a spread trader, not even a reversion trader. I've just learned where to anticipate the beginning of strong movement and that's why highly probable setups I use always require certain price action to confirm entry.Ok..fair reply..can you briefly explain how high probability is linked to volatility..as by its nature.. volatility implies higher risk and possible large drawdowns if trades are held for a prolonged period..maybe I am picking you up wrong..but you can easily put me right.
I'm strictly a day trader (except for retirement investments) that would classify myself as a swing scalper. The highest probability setups need enough movement to make an entry worthwhile...nat.gas is best for me. Basically, I need a certain degree of that movement happening. I agree, prolonged holding periods combined with higher volatility increases risk, but not necessarily for day trading. I'm not a breakout trader (at least not purposely) or a spread trader, not even a reversion trader. I've just learned where to anticipate the beginning of strong movement and that's why highly probable setups I use always require certain price action to confirm entry.
So.. correct me if I am wrong..what you are really saying is that you have perfected your timing of entries and exits.. primarily in natural gas futures..that enables you to place low risk trades..with a high probability of attaining a positive risk/reward ratio with a set no. of trades..which yields consistent profits on a daily basis?
First of all, I wouldn't say on a daily basis...remember low frequency. Just because I exit trades before the end of the day (day trader) doesn't mean the setups show up every day. I've had 2-3 setups each week since July. Too many of these setups have taken max. time (I want out at a certain time of day) and have led to a wash or small cost to exit, this can be common...summer volatility is definitely here. I get the felling you're trying to set me up...how about you and your story. You tell me why your called MrScalper?So.. correct me if I am wrong..what you are really saying is that you have perfected your timing of entries and exits.. primarily in natural gas futures..that enables you to place low risk trades..with a high probability of attaining a positive risk/reward ratio with a set no. of trades..which yields consistent profits on a daily basis?
First of all, I wouldn't say on a daily basis...remember low frequency. Just because I exit trades before the end of the day (day trader) doesn't mean the setups show up every day. I've had 2-3 setups each week since July. Too many of these setups have taken max. time (I want out at a certain time of day) and have led to a wash or small cost to exit, this can be common...summer volatility is definitely here. I get the felling you're trying to set me up...how about you and your story. You tell me why your called MrScalper?
No..not at all..just wondering what you have found to be the most important thing in relation to making money..to me..it is all about timing.
I used to think.. foolishly..that I could scalp the ES effectively..but quickly learned it is a waste of time..and money!
The problem with scalping is too many trades..the more trades you do in one day..the more costs you run up..and the more you risk losing money.
I have found it is much better to trade less and wait for the best setups..which..is the same as perfecting your timing of entries and exits.
What do you think of buying bonds for income.. government or corporate..do you have any experience with same?