Some excerpts below. Emphasis added.
Everyone should be worried about global cooling and how everyone is going to eat in the future not global warming.
https://benthamopen.com/FULLTEXT/TOASCJ-11-44
Abstract
The Sun as climate driver is repeatedly discussed in the literature but proofs are often weak. In order to elucidate the solar influence, we have used a large number of temperature proxies worldwide to construct a global temperature mean G7 over the last 2000 years. The Fourier spectrum of G7 shows the strongest components as ~1000-, ~460-, and ~190 - year periods whereas other cycles of the individual proxies are considerably weaker. The G7 temperature extrema coincide with the Roman, medieval, and present optima as well as the well-known minimum of AD 1450 during the Little Ice Age. We have constructed by reverse Fourier transform a representation of G7 using only these three sine functions, which shows a remarkable Pearson correlation of 0.84 with the 31-year running average of G7. The three cycles are also found dominant in the production rates of the solar-induced cosmogenic nuclides 14C and 10Be, most strongly in the ~190 - year period being known as the De Vries/Suess cycle. By wavelet analysis, a new proof has been provided that at least the ~190-year climate cycle has a solar origin.
Sun's Activity and Climate
Table (2) demonstrates that Stei [21] as the record mirroring the Sun's activity shows the same periods of ~1000, ~500, and ~200 years as found for the temperature record G7, suggesting the Sun as the main climate driver. This hypothesis is often emphasized in the literature (see references under “Introduction/Overview”). However, comparable periods alone would not to be sufficient for excluding autogenous climate mechanisms.
To get more insight on a solar link with climate cycles we compared by wavelet analysis the temperatures of Pet [2] with the production rate of the cosmogenic nuclides 14C and 10Be of Stei [21] over 9000 years (see Table 1. and Fig. 2). The upper and middle panel of Fig. (4) show already by eyesight similarities in the power of the ~190 - year period over 9000 years, thus confirming earlier findings of Knudsen et al. [13].
DISCUSSION / CONCLUSION
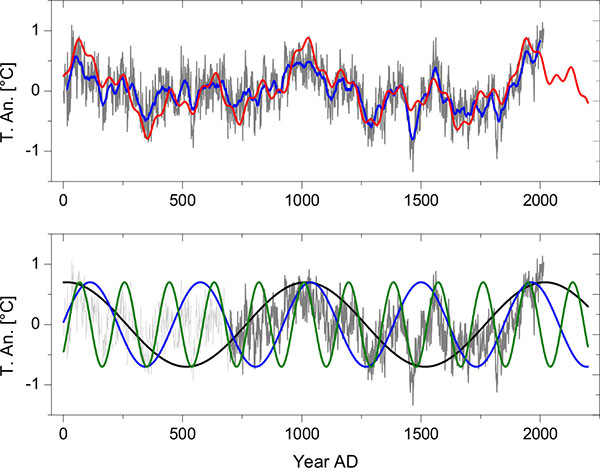
The Fourier spectrum of a global temperature record G7, composed of high quality temperature proxies worldwide and recent instrumental data demonstrate the dominance of three climate cycles with ~1000 (Eddy cycle), ~460 (not named but frequently reported), and ~190 year periods (De Vries/Suess cycle). These three sines represent the 31-year running mean of G7 with the remarkable Pearson correlation of 0.84 indicating their importance for climate.
G7, and likewise the sine representations have maxima of comparable size at AD 0, 1000, and 2000. We note that the temperature increase of the late 19th and 20th century is represented by the harmonic temperature representation, and thus is of pure multiperiodic nature. It can be expected that the periodicity of G7, lasting 2000 years so far, will persist also for the foreseeable future. It predicts a temperature drop from present to AD 2050, a slight rise from 2050 to 2130, and a further drop from AD 2130 to 2200 (see Fig. 3), upper panel, green and red curves).
As a main result of our study, the construction of a global record G7 from numerous temperature proxies reduces noise and thus allows the isolation of these global cycles. The dominance of the significant frequency components in the G7 spectrum, as opposed to the strength of other components in the spectra of the individual proxy records supports this view.
We provide a new confirmation for the link between solar activity and climate cycles by wavelet analysis showing a remarkably good agreement of the power of the ~190 - year period for temperatures and solar activity over 9000 years (see Fig. 4 lower panel). As (Fig. 2 and Table 2) show, the periods of ~1000 and ~460 years are also apparently common in records of temperatures and cosmogenic nuclides.
Everyone should be worried about global cooling and how everyone is going to eat in the future not global warming.
https://benthamopen.com/FULLTEXT/TOASCJ-11-44
Abstract
The Sun as climate driver is repeatedly discussed in the literature but proofs are often weak. In order to elucidate the solar influence, we have used a large number of temperature proxies worldwide to construct a global temperature mean G7 over the last 2000 years. The Fourier spectrum of G7 shows the strongest components as ~1000-, ~460-, and ~190 - year periods whereas other cycles of the individual proxies are considerably weaker. The G7 temperature extrema coincide with the Roman, medieval, and present optima as well as the well-known minimum of AD 1450 during the Little Ice Age. We have constructed by reverse Fourier transform a representation of G7 using only these three sine functions, which shows a remarkable Pearson correlation of 0.84 with the 31-year running average of G7. The three cycles are also found dominant in the production rates of the solar-induced cosmogenic nuclides 14C and 10Be, most strongly in the ~190 - year period being known as the De Vries/Suess cycle. By wavelet analysis, a new proof has been provided that at least the ~190-year climate cycle has a solar origin.
Sun's Activity and Climate
Table (2) demonstrates that Stei [21] as the record mirroring the Sun's activity shows the same periods of ~1000, ~500, and ~200 years as found for the temperature record G7, suggesting the Sun as the main climate driver. This hypothesis is often emphasized in the literature (see references under “Introduction/Overview”). However, comparable periods alone would not to be sufficient for excluding autogenous climate mechanisms.
To get more insight on a solar link with climate cycles we compared by wavelet analysis the temperatures of Pet [2] with the production rate of the cosmogenic nuclides 14C and 10Be of Stei [21] over 9000 years (see Table 1. and Fig. 2). The upper and middle panel of Fig. (4) show already by eyesight similarities in the power of the ~190 - year period over 9000 years, thus confirming earlier findings of Knudsen et al. [13].
DISCUSSION / CONCLUSION
The Fourier spectrum of a global temperature record G7, composed of high quality temperature proxies worldwide and recent instrumental data demonstrate the dominance of three climate cycles with ~1000 (Eddy cycle), ~460 (not named but frequently reported), and ~190 year periods (De Vries/Suess cycle). These three sines represent the 31-year running mean of G7 with the remarkable Pearson correlation of 0.84 indicating their importance for climate.
G7, and likewise the sine representations have maxima of comparable size at AD 0, 1000, and 2000. We note that the temperature increase of the late 19th and 20th century is represented by the harmonic temperature representation, and thus is of pure multiperiodic nature. It can be expected that the periodicity of G7, lasting 2000 years so far, will persist also for the foreseeable future. It predicts a temperature drop from present to AD 2050, a slight rise from 2050 to 2130, and a further drop from AD 2130 to 2200 (see Fig. 3), upper panel, green and red curves).
As a main result of our study, the construction of a global record G7 from numerous temperature proxies reduces noise and thus allows the isolation of these global cycles. The dominance of the significant frequency components in the G7 spectrum, as opposed to the strength of other components in the spectra of the individual proxy records supports this view.
We provide a new confirmation for the link between solar activity and climate cycles by wavelet analysis showing a remarkably good agreement of the power of the ~190 - year period for temperatures and solar activity over 9000 years (see Fig. 4 lower panel). As (Fig. 2 and Table 2) show, the periods of ~1000 and ~460 years are also apparently common in records of temperatures and cosmogenic nuclides.
Last edited: