You are using an out of date browser. It may not display this or other websites correctly.
You should upgrade or use an alternative browser.
You should upgrade or use an alternative browser.
Industries and etfs
- Thread starter eurusdzn
- Start date
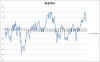
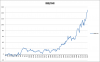
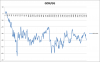
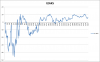
Steel and coal stocks. Relative etfs could be KOL for coal, and, SLX and possibly XME for steel.
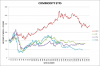
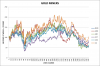
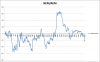
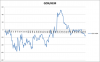
Data source is Yahoo free data. Weekly data , start = 7/2/2007 to week ending 2/14/2014.
Data source is Yahoo free data. Weekly data , start = 7/2/2007 to week ending 2/14/2014.
Attachments

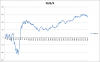
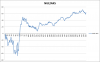
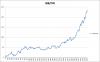
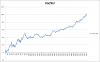
Weekly data from 7/2/2007 to 2/14/2014
Key:
IEI 2-3 yr treasury
TLH 7-10 yr US treasury
TLT 20+ US treasury
FXB British
FXE Euro
FXF Swiss
FXY Japan
FXC Canada
FXA Australia
UUP US dollar weighted basket vs. 5 currencies
Approximation for TLT:
From 29 Apr 2013 to Sep 9th 2013, (Weeks 243 to 223) TLT dropped from $123 to about $103 , about $20 or 16.2% (actual prices, not this 100 based chart, concidentally has prices close to actual TLT)
TLT changed about .14% (yeild of 2.49-3.65% or 116 bp in 20 year treasury) per basis point rise in the 20 year treasury .
Expect about 1% price change in TLT per 7 bp in 20 year or a little less if rates rise.
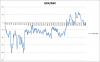
So, a spread has a leg that is the hedge. You expect to lose on this leg and neutralize
the other leg if it runs away in the wrong direction.
To make this even possible , dollar neutral spreads do not work where volatility of the two legs differ.
Take FB/YHOO. For a recent period FB is 3.1 x more volatile (atr or other similar measures)
So, to neutralize buy approx 3x more shares of yahoo than FB. Similar to DV01 for bonds.
Heres my problem. Charting the dollar neutral FB/YHOO spread for price action
and signals does not reflect the NEW price series you have when you put on the
1/3 ratio spread.
It is my beleif that i should apply the ratio to the original price series and look for opportunity in the actual price series that i will be putting on.
Why take signals from a dollar neutral chart whose PA differs from the price series
That you actially put on?
Any thoughts on this?
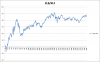
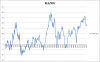
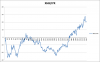
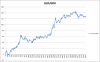
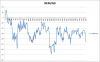
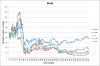
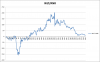
Interesting Charts
Media reports that Chinese collateral (copper) is being sold due to loans gone bad.
A few have been bearish on his board for a while on copper.
Possibly I will see these things a little sooner.
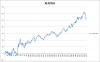
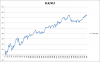
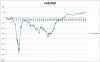
this chart is GLD-JJC etf volatility neutral spread
The data is from excel and imported into any retail charting package, ascii metastock format, after a shitload of work.
The chart is weekly starting Jun2007 and the last 47 weeks have been good
for 23%
A few have been bearish on his board for a while on copper.
Possibly I will see these things a little sooner.
this chart is GLD-JJC etf volatility neutral spread
The data is from excel and imported into any retail charting package, ascii metastock format, after a shitload of work.
The chart is weekly starting Jun2007 and the last 47 weeks have been good
for 23%