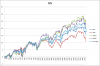
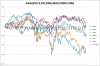
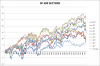
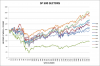
US major market etfs
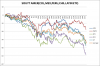
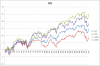
Europe major country etfs
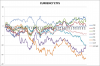
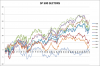
Asia country etfs
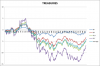
Commodity country producer etfs( some overlap)
South America country etfs
BRIC ( again a view overlapping with others)
US treasury etfs
Major currency etfs
Major commodity etfs(oil,ng,copper,gold,silver)
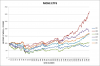
100 Industries( avg of 5 stocks per industry)
Looking in the right direction may produce trade ideas. An example would
Be to focus on internet content providers vs. software of service providers
for the past year. Or, stay away from the underperformng oil and gas industries
the past year. Splittimg hairs? Maybe.
More general observations such as Europe country etfs have been performing
better than South American etfs may be enough.
Of course real time observations for the daily or weekly bar trader/investor would
be the goal here. Noticing changes with a wide feild of view( listed above)
No rules. Open thread. Exchange of ideas. Just talk.
I am learning to save an excel chart as a .whatever to post. I will gather some relative
Strength of things tommorrow and post.
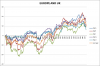
Europe major country etfs
Asia country etfs
Commodity country producer etfs( some overlap)
South America country etfs
BRIC ( again a view overlapping with others)
US treasury etfs
Major currency etfs
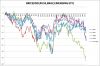
Major commodity etfs(oil,ng,copper,gold,silver)
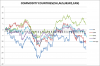
100 Industries( avg of 5 stocks per industry)
Looking in the right direction may produce trade ideas. An example would
Be to focus on internet content providers vs. software of service providers
for the past year. Or, stay away from the underperformng oil and gas industries
the past year. Splittimg hairs? Maybe.
More general observations such as Europe country etfs have been performing
better than South American etfs may be enough.
Of course real time observations for the daily or weekly bar trader/investor would
be the goal here. Noticing changes with a wide feild of view( listed above)
No rules. Open thread. Exchange of ideas. Just talk.
I am learning to save an excel chart as a .whatever to post. I will gather some relative
Strength of things tommorrow and post.