Quote from Seenthelight:
j2ee I used to believe in TA but now I read it mostly to gauge what people are thinking. It is too subjective and like you said we see what we want to see. I found a guy doing the ebbchart which is unlike anything out there. It is creative and innovative which is why it works. Unlike regular TA charts his chart patterns are objective and quantifiable. His chart patterns were published for the past six years (documented) and his big discovery came to light this year after he did the timeline of his ebbchart triple patterns._This is what he did for six years.
He used cycles to get a buy (green) or short (red) signal from three ETFs - SPY, VXF, EFA. Say on Monday he gets a buy signal for SPY, VXF, EFA. That is green-green-green (pattern 1). On Tuesday, a buy signal for SPY, VXF and a short signal for EFA. _That is green-green-red (pattern 2). The other possible patterns are green-red-red (pattern 3), green-red-green (pattern 4), red-red-red (pattern 5), red-red-green (pattern 6), red-green-green (pattern 7), and red-green-red (pattern 8). Eight possible patterns and he recorded the results of SPY, VXF, EFA for whatever pattern shows each day. What is interesting is how his green patterns ,GGG, GGR, GRG, RGG and red patterns, RRR, RRG, GRR, RGR behaved. The green patterns had a 52% winning percent, the reds had 55%. Pattern 5 (red-red-red) for VXF had the highest win percent at 60%. Pattern 1 (green-green-green) for EFA had the lowest win percent at 50%. _FYI, win percent for S&P500 index is 53%. His patterns are indeed contrarian. His best discovery this year is the triple patterns. Does not happen often but is simple to spot. A pattern (1-8) that appears in three consecutive trading days is a triple pattern. He says it is an aberration but is significant because it marks a turning point in the market.
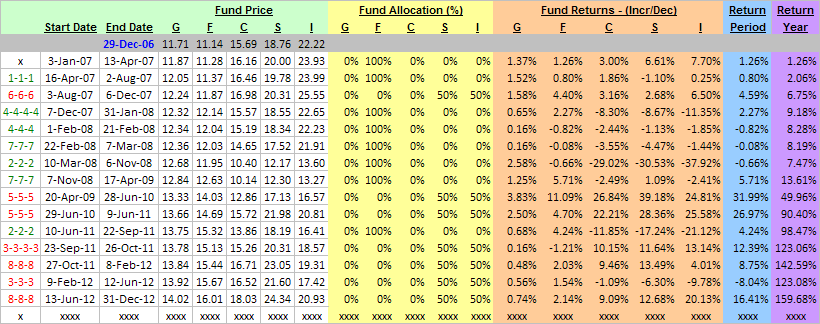
13 of 14 triple patterns were correct in predicting the market since 2007. Used with VXF, the gains are over 160% in six years. With TNA, gains are over 750%. Check out his ebbchart primer to learn more. All this using only six moves in six years.
His ebbchart triple patterns timeline signals -
April 16, 2007 to August 2, 2007 - SHORT
August 3, 2007 to December 6, 2007 - BUY
December 7, 2007 to April 17, 2009 - SHORT
April 20, 2009 to June 9, 2011 - BUY
June 10, 2011 to September 22, 2011 - SHORT
September 23, 2011 to February 8, 2012 - BUY
Avoided the 2008 and 2011 crashes. Holy grail, time will tell.
_
_
Who is ebbchart and you subscribe his service?

 ).
).