If Wave and Gann Theories are just joke, why do we believe in other pattern?

Quote from Seenthelight:

j2ee I used to believe in TA but now I read it mostly to gauge what people are thinking. It is too subjective and like you said we see what we want to see. I found a guy doing the ebbchart which is unlike anything out there. It is creative and innovative which is why it works. Unlike regular TA charts his chart patterns are objective and quantifiable. His chart patterns were published for the past six years (documented) and his big discovery came to light this year after he did the timeline of his ebbchart triple patterns._This is what he did for six years.

He used cycles to get a buy (green) or short (red) signal from three ETFs - SPY, VXF, EFA. Say on Monday he gets a buy signal for SPY, VXF, EFA. That is green-green-green (pattern 1). On Tuesday, a buy signal for SPY, VXF and a short signal for EFA. _That is green-green-red (pattern 2). The other possible patterns are green-red-red (pattern 3), green-red-green (pattern 4), red-red-red (pattern 5), red-red-green (pattern 6), red-green-green (pattern 7), and red-green-red (pattern 8). Eight possible patterns and he recorded the results of SPY, VXF, EFA for whatever pattern shows each day. What is interesting is how his green patterns ,GGG, GGR, GRG, RGG and red patterns, RRR, RRG, GRR, RGR behaved. The green patterns had a 52% winning percent, the reds had 55%. Pattern 5 (red-red-red) for VXF had the highest win percent at 60%. Pattern 1 (green-green-green) for EFA had the lowest win percent at 50%. _FYI, win percent for S&P500 index is 53%. His patterns are indeed contrarian. His best discovery this year is the triple patterns. Does not happen often but is simple to spot. A pattern (1-8) that appears in three consecutive trading days is a triple pattern. He says it is an aberration but is significant because it marks a turning point in the market.

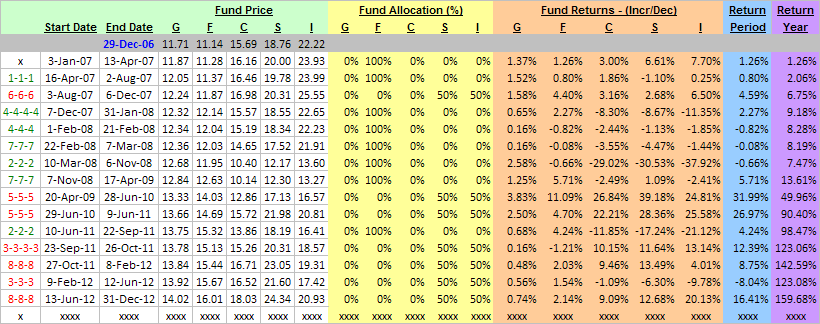
13 of 14 triple patterns were correct in predicting the market since 2007. Used with VXF, the gains are over 160% in six years. With TNA, gains are over 750%. Check out his ebbchart primer to learn more. All this using only six moves in six years.

His ebbchart triple patterns timeline signals -
April 16, 2007 to August 2, 2007 - SHORT
August 3, 2007 to December 6, 2007 - BUY
December 7, 2007 to April 17, 2009 - SHORT
April 20, 2009 to June 9, 2011 - BUY
June 10, 2011 to September 22, 2011 - SHORT
September 23, 2011 to February 8, 2012 - BUY

Avoided the 2008 and 2011 crashes. Holy grail, time will tell.
_

_

Who is ebbchart and you subscribe his service?
 
Quote from jcl:

I can also not understand why someone would trade manually when he's following a rational system that he could describe in a script and trade automatically.

I mean, by staring at price curves you do not learn anything useful, nor do you do anything for the common good, nor do you have any fun. What do you do when you're 80 and have nothing done in your life except brooding over the prices of now long forgotten stocks? Manual trading is in my opinion a sad example of completely wasted life time.

For some people staring @ charts and trading itself is great fun, I know at least one person who is approaching 70 and trades for decades (profitably), he could retire long time ago, but keeps day trading, saying it's such a great game!

Definition of "fun" as well as "boring" is very subjective.

Also you do learn a lot of useful stuff looking at charts, if you see not just the charts, but the people commiting their decisions behind them... Charts (markets in the broader sense of analysis) reflect world's economics and mass psychology in such a great way I doubt there are many other ways to observe the real rithm of the world's breathing which can compete. It can be very, very interesting and exciting.

So "staring at charts" is more than just the money.

P. S. Speaking of Gann etc... Have no idea, prefer to trust only what my own experienced eyes tell me works, not what someone else wrote about...
 
Quote from R. Raskolnikov:

I don't think patterns have really changed at all. I've been using the same sequences of price bars, OHLC and volume for over a decade. Same sequences that worked then work today. Maybe some other patterns that I'm not familiar with have changed but I can say confidently that not all patterns have changed.

Yep. Patterns after all are patterns of human psychology, not some magical "working" curves. And human psychology barely changed (if at all) during at least a few thousands of years so far (not sure what was before that due to absense of documented historical evidence, but guess it was still the same :) ).
 
I think it depends if you can get your system automated or not. I am in contact with a programmer who I may pay $ 50/hr to code one of my setups.

Also, remember, you don't need to stare at a screen all day. You can spend say 1 hour waiting for your setup, once you go short or long, you can set a target and stop and not have to watch the chart anymore.

Quote from j2ee:

Any of you trade with 100% auto trading? It can be 100% objective and you don't need to feel any pressure. If you don't auto trade, why do you manual trade? What is the advantage in your option?
 
Quote from j2ee:

Who is ebbchart and you subscribe his service?

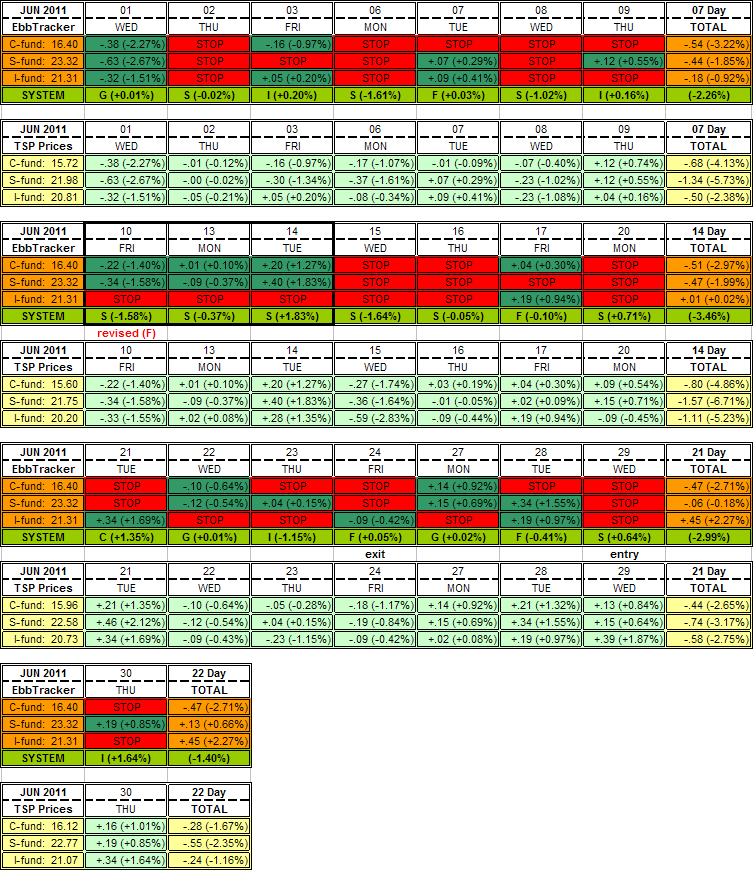
He publishes his daily patterns (1-8) a week or two in advance. You can trade his daily patterns but recommends following the triple patterns (long term) which could be bullish (red) or bearish (green) depending on the pattern. Here is an example of his bearish pattern 2 (green-green-red) that appeared three days in a row signaling a triple pattern (2-2-2) on June 10, 2011. It marked the 2011 summer crash.

Legend: C-Fund = SPY; S-Fund = VXF; I-Fund = EFA; F = AGG bonds; G = gov. bonds
ebbchart_06_2011.gif


The chart below shows the timeline of the triple patterns and how it fared.

triples_all.gif


I copied and pasted these charts from the ebbchart primer site.
 
Quote from oraclewizard77:

I think it depends if you can get your system automated or not. I am in contact with a programmer who I may pay $ 50/hr to code one of my setups.

Also, remember, you don't need to stare at a screen all day. You can spend say 1 hour waiting for your setup, once you go short or long, you can set a target and stop and not have to watch the chart anymore.

You just need to pay $5 per hour to hire a top programmer in China to do even a much better job.
 
Quote from Seenthelight:

He publishes his daily patterns (1-8) a week or two in advance. You can trade his daily patterns but recommends following the triple patterns (long term) which could be bullish (red) or bearish (green) depending on the pattern. Here is an example of his bearish pattern 2 (green-green-red) that appeared three days in a row signaling a triple pattern (2-2-2) on June 10, 2011. It marked the 2011 summer crash.

Legend: C-Fund = SPY; S-Fund = VXF; I-Fund = EFA; F = AGG bonds; G = gov. bonds
ebbchart_06_2011.gif


The chart below shows the timeline of the triple patterns and how it fared.

triples_all.gif


I copied and pasted these charts from the ebbchart primer site.

Only subscribe can seeing these data. If he is really that good, why need to create a website to ask people to subscribe and even have google adsense ad on it?
 
Demark is an extremely smart person after reading some of his books. No doubt the most successful financial people / company ask him to advise/teach.
 
Quote from j2ee:

Only subscribe can seeing these data. If he is really that good, why need to create a website to ask people to subscribe and even have google adsense ad on it?

Why should anyone help you?
 
Quote from Wide Tailz:

Why should anyone help you?

I just try to discuss with people who feel this topic is interesting, I haven' asked for any help in this post.
 
Back
Top