
Identifying trend

I am going to ask some questions that may seem elementary, but I feel it's best to ask them.

For now...

I mentioned previously about looking for a minimum slope to see a trend. But in addition to this, you can look at the same chart and stretch or shrink it vertically and the trend will look bigger or smaller. I will now post 3 pictures of the same chart, differing only by the amount I stretched it vertically.

Thoughts? Is there a "normal"?


I think I previously posted as a reply that angle of slope of an EMA is irrelevant, it does not indicate anything as its a function of chart scaling. Direction of slope is an indicator of trend direction.
 
I saw that it was clearly trending down consistently for 2 weeks based on a 90ema. (This was the only currency pair out of about 10 that I checked that I could say this about)

I sold it, and placed SL and TP at points that I eyeballed that would make my prediction either true or false. I got busy with other things, fell asleep for a few hours, and by the time I remembered about it again, I had closed at the TP for $929.

Then a few hours later, I scanned currency pairs (I currently only scan popular pairs because they have the least bid-ask spread). Once again, EUR/USD was the only one with a clear trend. I sold it. This time, I closed it manually at a profit of $143 because I didn't want to get too greedy for the day.


Trend-following is as simple as that.
 
Trend-following is as simple as that.

I've been looking at a more complicated strategy that I found on YouTube involving using three different ema's and looking for chart patterns for entry and exit points.

I think I might just forget the YouTube video and keep it simple.
 
I've been looking at a more complicated strategy that I found on YouTube involving using three different ema's and looking for chart patterns for entry and exit points.

I think I might just forget the YouTube video and keep it simple.


At least start simple - 1 EMA, trend, pull-back.

Some people say even one EMA is too much on the chart. Right or wrong about this, their principle is correct - everything you use needs to pay for its place on the screen.
 
At least start simple - 1 EMA, trend, pull-back.

Some people say even one EMA is too much on the chart. Right or wrong about this, their principle is correct - everything you use needs to pay for its place on the screen.

You recommend always waiting for a pullback?

If so, is this defined by any indicator? Or just eyeball it?
 
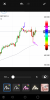
Here's a trade I lost. I got closed out on a "pin bar."

I entered at the blue. I'm wondering if there's a way to avoid getting closed out on pin bars, because I've heard they are actually a sign in the opposite direction. If I hadn't gotten closed on the pin bar, I bet I would have won the trade.
 

Attachments

  • Screenshot_20200213-200330.png
    Screenshot_20200213-200330.png
    340.7 KB · Views: 27
Back
Top