You are using an out of date browser. It may not display this or other websites correctly.
You should upgrade or use an alternative browser.
You should upgrade or use an alternative browser.
Identifying trend
- Thread starter farmerjohn1324
- Start date
fj
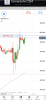
?post a screenshot gbp/huf 1hour chart to current time?
include that low candle below 403.00 in the shot?
thx man.
that's a nice screen layout you have.
what smartphone and software do you use?
View attachment 219365
Despite the fact that it eventually went down again, I would have actually closed my TP at a profit.
Android. IG Forex.
Attachments
fj, how do you go about picking your exit prices?
Eyeball what would prove my trade right or wrong.
Then I might adjust later to lock in some gains or move SL to zero, or something like that.
do you see much volume on that currency pair?
Is that a lot?
Attachments
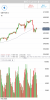
do you see much volume on that currency pair?
That is a trick question...
Forex DOES NOT have any complete or reliable volume. There is no central "exchange". Some dealers offer a volume based on their clients, but as stated that is no where near being complete, reliable, or representative of the full market of a pair.
OTOH, currency futures DO have complete and reliable volume, BUT it is does not encompass the forex, and therefore is reliable only for trading the futures.
not bad, usdgbp behaved likewise.a lot?
Keep Raking It In!
https://www.tradingview.com/symbols/HUFGBP/?exchange=FX_IDC
Last edited:

You will make things so much easier and more obvious if you move from using one hour data to weekly data when it comes to identifying a legit 'trend'.
It always slays me when I see people talking about 'trend' and using short(er) term data.
Back in the time that I day traded - I used 360 minute data
It always slays me when I see people talking about 'trend' and using short(er) term data.
Back in the time that I day traded - I used 360 minute data
I am going to ask some questions that may seem elementary, but I feel it's best to ask them.
For now...
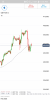
I mentioned previously about looking for a minimum slope to see a trend. But in addition to this, you can look at the same chart and stretch or shrink it vertically and the trend will look bigger or smaller. I will now post 3 pictures of the same chart, differing only by the amount I stretched it vertically.
Thoughts? Is there a "normal"?
You will make things so much easier and more obvious if you move from using one hour data to weekly data when it comes to identifying a legit 'trend'.
It always slays me when I see people talking about 'trend' and using short(er) term data.
Back in the time that I day traded - I used 360 minute data
Really? Weekly? Here's a chart using weekly bars. The left side of the chart goes all the way back to 2013. At those long timeframes, aren't technicals meaningless?