I remember the Swede's hay days when they were atop the tennis world... Borg, Edberg, Wilander, etc.... they all were citizens of Monaco.. because of Sweden's taxes.
You are using an out of date browser. It may not display this or other websites correctly.
You should upgrade or use an alternative browser.
You should upgrade or use an alternative browser.
How Sweden fights inequality — without soaking the rich
- Thread starter dbphoenix
- Start date
The Socialists in the UK are trying to restore their cred with the poor by proposing a Mansion Tax. This a one off yearly tax of £15,000 on anyone who has a property worth over £2m. My rich friend rang me up to complain bitterly how unfair that is. He has 3 such properties in the UK and some more abroad. I wasn't too sympathetic to be honest.
To understand how income in the U.S. was slowly redistributed upward from the middle class one has to look several places, but certainly a major contributor was the 1980s revision of the prior, steeply progressive, marginal income tax rates that existed following WWII. At one point, after the top marginal rate was slashed and the bottom marginal rate raised, the U.S. rates approached a flat tax with very little difference between lowest and highest marginal rates. This was later, in stages, undone to some extent, however the rates remain today much less progressive than they once were. The 1980 experiments with supply-side economics and flattening of the marginal rates marked the beginning in the United States of redistribution of wealth from the middle class to the wealthy. This, however, is by no means the only factor that resulted in wealth redistribution following the "the great compression of the post WWII period.
The GINI coefficient is a commonly used measure of dispersion for the wealth distribution function for a particular country. A value of 0 means everyone's income is identical and 1 means that oneperson has all the income. In countries we think of as quite socialistic the GINI coefficient is in the 20s to mid 30s. Sweden = 0.23 ;Canada and France, 0.32; U.S., South Africa, Iran, China, Russia, Brazil ~ .45


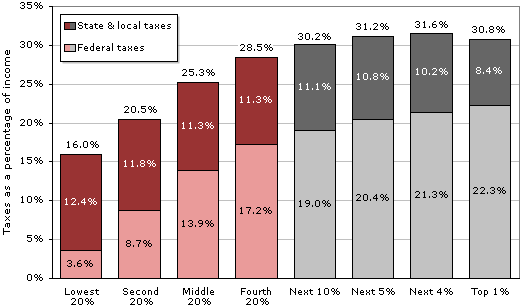
The following chart is for for tax year 2009. If we had a similar chart from the 1950's it would be immediately obvious how much flatter the rate structure is today. Note that between the fourth quintile and the top 1% there is only a 5% difference. The rates are progressive, but only minimally so.
Finally, here is a silly cartoon I turned up from the Huffington Post.

These charts can all be turned up by googling "Wealth Distribution in the U.S."
The GINI coefficient is a commonly used measure of dispersion for the wealth distribution function for a particular country. A value of 0 means everyone's income is identical and 1 means that oneperson has all the income. In countries we think of as quite socialistic the GINI coefficient is in the 20s to mid 30s. Sweden = 0.23 ;Canada and France, 0.32; U.S., South Africa, Iran, China, Russia, Brazil ~ .45
The following chart is for for tax year 2009. If we had a similar chart from the 1950's it would be immediately obvious how much flatter the rate structure is today. Note that between the fourth quintile and the top 1% there is only a 5% difference. The rates are progressive, but only minimally so.
Finally, here is a silly cartoon I turned up from the Huffington Post.
These charts can all be turned up by googling "Wealth Distribution in the U.S."
Since Sweden's GDP is less than the city of Chicago, it makes you wonder about the validity of such a comparison. And I'd love to see Sweden try their "progressive" plan with Chicago's demographics.
http://knowmore.washingtonpost.com/...ivia-about-the-enormous-output-of-u-s-cities/
http://knowmore.washingtonpost.com/...ivia-about-the-enormous-output-of-u-s-cities/
History shows it is really sensible to share the wealth around.
One way is to make available opportunity, to any who have the energy and expertise, around fairly too.
Yeah, like when the Soviet Union redistributed wealth from the more productive farmers. Food became scarce, and as many people died of starvation in the 1930s USSR as they did in Hitler's
Holocaust.
Yeah, like when the Soviet Union redistributed wealth from the more productive farmers. Food became scarce, and as many people died of starvation in the 1930s USSR as they did in Hitler's
Holocaust.
2 out of 3 of the biggest mass murderers in the whole of human history. Even so, got some apologists for their crimes .
It would have been rough justice and a lesson to the future mass murderers if the Nazis had been stuffed into Auschwitz and the Communists into their own Siberian gulags.
Buffett's secretary Bosanek pays a tax rate of 35.8 percent of INCOME, while Buffett pays a rate at 17.4 percent on PROFITS.
http://news.yahoo.com/warren-buffett-secretary-talk-taxes-221442297--abc-news.html
Ideally
Bosanek should pay 17.4 percent tax on her SAVINGS.
OR
Buffet should pay 35.8 percent tax on his INCOME.
http://news.yahoo.com/warren-buffett-secretary-talk-taxes-221442297--abc-news.html
Ideally
Bosanek should pay 17.4 percent tax on her SAVINGS.
OR
Buffet should pay 35.8 percent tax on his INCOME.