https://www.skepticalscience.com/underground-temperatures-control-climate.htm
Q
Climate Myth...
Underground temperatures control climate
"There are other possible causes for climate change which could be associated with solar activity or related to variations in the temperature of the liquid core of the Earth, which is about 5,400 degrees Celsius. We don't need a high heat flow - just a high temperature for the core to affect the surface climate. There is massive heat inside the Earth" (Doug Cotton)
UQ
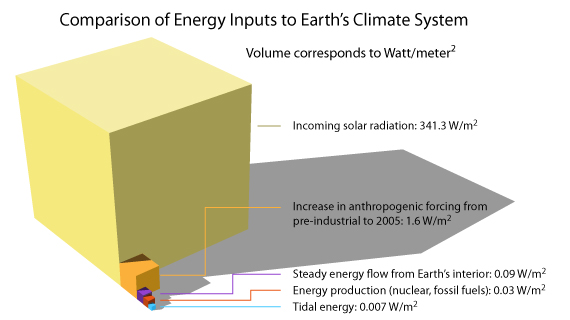 Figure 4: The volumes of the cubes are proportional to the magnitude of the energy flow from various sources. The solar irradiance is the incident energy, averaged over the area of the Earth (divided by four); irradiance varies over 11 year cycles and, at the top of recent cycles, can reach 341.7 Wm-2. The increase in anthropogenic forcing since pre-industrial times comes from the IPCC. The heat flow from the Earth’s interior is the 47 TW figure (see Figure 3 caption) averaged over the surface area. The energy flow from the human energy production is based on Flanner (2009). Tidal energy is the total energy input from the gravitational interaction between the Earth, Moon and Sun; a small part of this energy is included in the energy flow from the Earth’s interior (see below for further discussion).
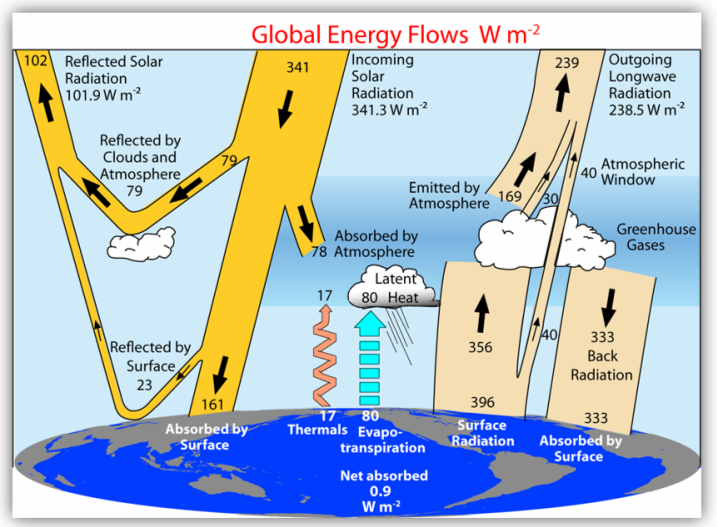 Figure 6. The global annual mean Earth’s energy budget for 2000 to 2005 (W m–2). The widths of the columns are proportional to the sizes of the energy flows. From Trenberth et al (2009).
Q
Comments 1 to 1:
william at 06:12 AM on 19 September, 2011
Clearly, the heat from inside the earth does not have any effect on the weather or the climate in the sense that this article explores. However, the heat from the earth may possibly have a contributory effect on ending a glacial and nudging us into an interglacial. In that sense, it would have a major effect on the climate. See:
http://mtkass.blogspot.com/2011/09/continental-glacier-meltdown.html
William
UQ
Q
Climate Myth...
Underground temperatures control climate
"There are other possible causes for climate change which could be associated with solar activity or related to variations in the temperature of the liquid core of the Earth, which is about 5,400 degrees Celsius. We don't need a high heat flow - just a high temperature for the core to affect the surface climate. There is massive heat inside the Earth" (Doug Cotton)
UQ
What influence do underground temperatures have on climate?
What the science says...
The flow of energy outwards from the interior of the Earth is 1/10,000th of the size of the energy flow from the Sun. Furthermore, over the past few million years, the heat flow from deep in the Earth has also remained very steady compared to other climatic factors. Heat from the bowels of the Earth does not influence climate in any significant way.
Consider:
The center of the Earth is at a temperature of over 6000°C, hotter than the surface of the Sun.
We have all seen pictures of rivers of red-hot magma pouring out of volcanoes.
Many of us have bathed in natural hot springs.
There are plans to exploit geothermal energy as a renewable resource.
Common sense might suggest that all that heat must have a big effect on climate. But the science says no: the amount of heat energy coming out of the Earth is actually very small and the rate of flow of that heat is very steady over long time periods. The effect on the climate is in fact too small to be worth considering.
The Earth’s heat flow
Where does the heat come from?
There are radioactive elements in the Earth, mainly potassium, uranium, and thorium, that have long half-lives. When their nuclei decay, they give off heat, as in a nuclear reactor. Some researchers say that "the vast majority of the heat in Earth's interior—up to 90 percent—is fueled by the decaying of radioactive isotopes", while other scientists claim that "heat from radioactive decay contributes about half of Earth’s total heat flux". More here.
The Earth is still hot from the time the planet formed from the agglomeration of smaller bits and pieces. Even more heat was gained as the high-density materials, such as iron and nickel, subsequently separated out and formed the core of the Earth.
The mostly solid, rocky outer layers of the Earth, the crust and mantle, have low thermal conductivity, acting as a thermal blanket slowing down the passage of heat to the surface. In the very early stages of the Earth’s history, internal temperatures and heat flows were probably much higher than they are today, partly because the planet had only just started to cool, and partly because the energy flow from radioactive decay was much larger then.
How does the heat get to the surface?
Figure 1: Showing mantle convection cells, which are responsible for transporting most of the Earth’s heat from the interior to the surface. Wikipedia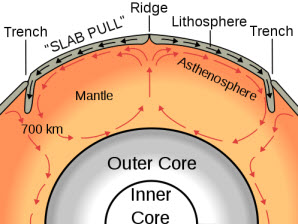
Figure 2: Red indicates the oceanic ridges where mantle convection comes to the surface and where new ocean crust is formed. The colors indicate the age of the oceanic crust, with the purple being the oldest. Source.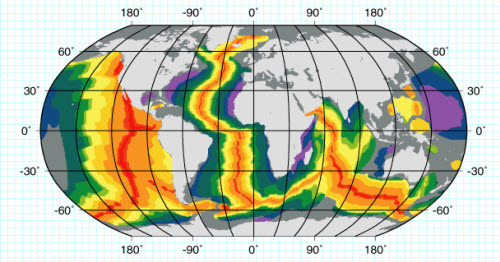
How do we measure heat flow?
Figure 3: Heat flow at the surface of the earth, from Davies and Davies (2010). Heat flow units are in mWm-2. Note how the areas of highest heat flow follow the mid-ocean ridges. The largest areas of measurement uncertainty are along the very crests of the ridges and under the Greenland and Antarctic ice caps. The total heat flow for the planet is 47 TW +/- 2TW, which is equivalent to 0.09Wm-2 (90mWm-2).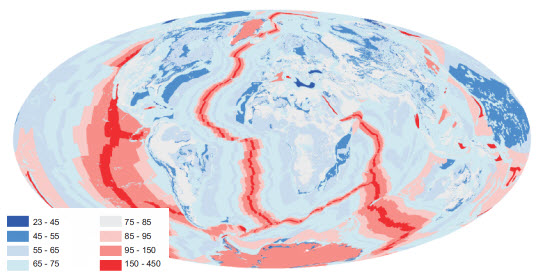
How does heat flow from the interior of the Earth compare with other inputs of energy into the climate system?
Tidal Energy
Figure 5: From Munk and Wunsch (1998) showing an “impressionistic” (their word) budget of tidal energy fluxes.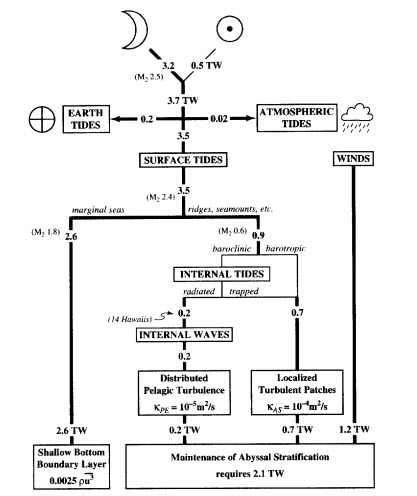
Science isn’t always common sense
For example, on this figure, a line representing geothermal energy flow would have a thickness of 6 microns, the thickness of a strand of spider-web silk; ocean tidal energy, one-tenth of that; Earth tidal energy less than one-tenth even of that. Our intuitions tell us that earthquakes, volcanoes, geysers and tides are mighty forces of nature and, in relation to a human individual, they are. But compared to the transfers of energy within the climate system, they are too puny to merit consideration.
Last updated on 19 September 2011 by Andy Skuce.
Q
Comments 1 to 1:
william at 06:12 AM on 19 September, 2011
Clearly, the heat from inside the earth does not have any effect on the weather or the climate in the sense that this article explores. However, the heat from the earth may possibly have a contributory effect on ending a glacial and nudging us into an interglacial. In that sense, it would have a major effect on the climate. See:
http://mtkass.blogspot.com/2011/09/continental-glacier-meltdown.html
William
UQ
Last edited: