You are using an out of date browser. It may not display this or other websites correctly.
You should upgrade or use an alternative browser.
You should upgrade or use an alternative browser.
Global Warming: For Experts Only
- Thread starter julianVGS
- Start date

Maybe you wizards of science can explain how taxing me will prevent China, India, and Russia from polluting. Perhaps you can enlighten us that after all we have done to clean up our own environmental mess, the USA is still asked to do more while the rest of the major polluters do next to nothing. And when you're done with that, then you can explain all the MANY climate shifts that happened before a smokestack ever darkened the sky.
I don't believe anyone is saying that CO2 is the ONLY factor influencing the climate. There is the sunspot cycle, the amount of sulphur in the atmosphere, volcanos, El Nino and so forth. I also would agree that there is massive hypocrisy in the environmental movement. However this does not alter the fact that greenhouse gases are causing climate change, and ultimately could fry us all.Maybe you wizards of science can explain how taxing me will prevent China, India, and Russia from polluting. Perhaps you can enlighten us that after all we have done to clean up our own environmental mess, the USA is still asked to do more while the rest of the major polluters do next to nothing. And when you're done with that, then you can explain all the MANY climate shifts that happened before a smokestack ever darkened the sky.

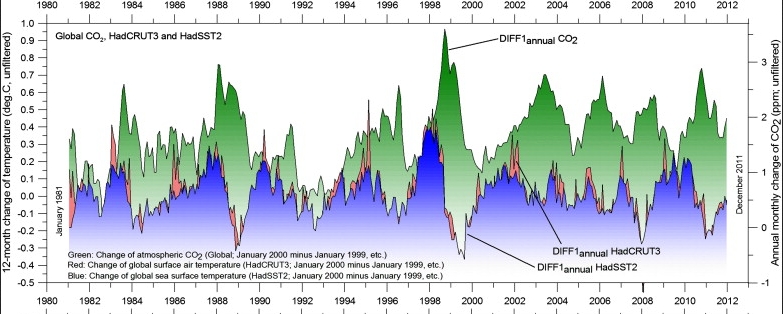
Change in Ocean temps leads change in surface temps by 3 months which leads change in co2 levels by 9 months.
peer reviewed.
so now you have a good idea why there is no peer reviewed science stating man made co2 is causing the warming. co2 levels trail ocean warming.
http://www.sciencedirect.com/science/article/pii/S0921818112001658
peer reviewed.
so now you have a good idea why there is no peer reviewed science stating man made co2 is causing the warming. co2 levels trail ocean warming.
http://www.sciencedirect.com/science/article/pii/S0921818112001658
Carbon dioxide captures heat. If the amount of carbon dioxide in the atmosphere is increasing then the temperature will go up.
Can someone please give me an executive summary of where the controversy lies? Just in a couple of sentences.

Just as a matter of interest how did you get the actual paper? I only read the abstract.Change in Ocean temps leads change in surface temps by 3 months which leads change in co2 levels by 9 months.
peer reviewed.
so now you have a good idea why there is no peer reviewed science stating man made co2 is causing the warming. co2 levels trail ocean warming.
http://www.sciencedirect.com/science/article/pii/S0921818112001658
It has been critiqued on the following grounds:
•These conclusions stem from methodological errors and from not recognizing the impact of the El Niño–Southern Oscillation on inter-annual variations in atmospheric CO2.
•The conclusion of natural CO2 rise since 1980 not supported by the data
•Their use of differentiated time series removes long term contributions.
•This conclusion violates conservation of mass.
•Further analysis shows that the natural contribution is indistinguishable from zero.
•The calculated human contribution is sufficient to explain the entire rise.
The full paper has been available for free if you click around you might find it.
I have probably linked to it here in the past. I read it.
1. conservation of mass is an amateur argument.
the earth absorbs co2, and there are articles showing it also off gases co2. We are far from a closed system.
2. The use of the differentiated time series is designed to show longer trends and eliminate the shorter term influence of seasonality.
Its well designed to pick up long term trends. Any seasoned trader knows that technique. The author of that critique obviously was throwing out buzzword without any comprehension.
3. CO2 has risen per data from mona loa.... Not sure how you could conclude natural co2 has not risen unless you disregard there are natural sinks and off gassing. I can show you charts showing the rise in co2 corresponds most closely with natural emissions and the human contribution does not.
here is more for your edification... we really don't have proof...
http://www.drroyspencer.com/2014/08/how-much-of-atmospheric-co2-increase-is-natural/7
As a first step, if we do simple correlations between the atmospheric CO2 variations with the other variables we find the highest correlation between temperature and CO2, and a little lower correlation with anthropogenic emissions:
Correlations with Yearly Atmospheric CO2 increases (1959-2012)
T_ocean : 0.70
T_land: 0.71
Fossil Fuels: 0.67
Ocean sink: 0.63
Land Use: -0.36
The fact that temperature has a higher correlation with yearly CO2 changes than does the anthropogenic source shows just how strongly the temperature variability affects atmospheric CO2 content.7
But correlating data with substantial trends in the data can be deceiving. Strictly speaking, all linear trends are perfectly correlated with each other, even those which have no causal relationship whatsoever between them.
So, we can detrend all of the data, and see what information is contained in the departures from the linear trends. This reduces the correlations substantially, since the variability associated with the trends has been removed:
Correlations with Yearly Atmospheric CO2 variations (1959-2012, detrended)
T_ocean : 0.35
T_land: 0.34
Fossil Fuels: 0.13
Ocean sink: 0.01
Land Use: 0.00
We see that the correlation between atmospheric CO2 and temperature remains the strongest, but the fossil fuel signal is very small, possibly because the detrended variations in anthropogenic emissions are quite small, and so subject to greater errors.
more at link...
Last edited:
The Weather Channel describes some benefits of hurricanes.
Drought buster
Hurricanes can bring much needed moisture to drought stricken areas, replenishing lakes, rivers and reservoirs. Sure, there can be too much of a good thing. Mother Nature didn’t mandate that the Houston and South Florida be paved over. Roads, parking lots, buildings, all covering the landscape, preventing water sinking into the ground.
Anti-bacterial
Hurricanes oxygenate the surface waters, breaking up bacteria and the red tide common along the Gulf Coast.
Heat balance
Hurricanes, due to their size and extension into the atmosphere are an efficient means of dissipating equatorial ocean heat. As warm water is sucked into the hurricane, cooler water from ocean depths replaces the warm water, balancing the temperature, leaving cooler water in its wake. This may weaken subsequent storms, as evidenced by Hurricane Jose, on the heels of Irma, petering out and not reaching US mainland. Without this heat balance, the poles would get colder and the tropics hotter. Hurricanes maintain the balance.
Island rejuvenation
Hurricanes, by sucking up sand and nutrients from the ocean floor, pushing this toward the barrier islands, builds them up, preventing natural erosion which would eventually cause these islands to sink into the ocean.
Johnny Appleseed
Hurricane winds carry seeds and spores hundreds of miles inland, far from where they normally fall. Strong winds remove weak or damaged trees and branches, much as forest fires do, a form of a haircut for plant life.