Everyone thinks QE lowers bond rates, but the evidence is pretty obviously the opposite: every episode of QE has seen rising rates, and every time they pull back, rates have fallen.
Anyway, I'm bullish gold now, along with every other commodity. Gold less so, as it is probably still digesting its fall from last year. But I'm starting to get in for the long term with the miners, whose rise will precede that of gold anyway, if we're setting up for another run.
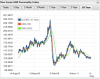
For commodities in general, you can look at almost any chart and see a pattern of lower prices AND (this is the important part) lower volatility. The latter means expectations are now very low for commodity prices. That's a very good thing.
Attached is a 10 year chart of the
Dow Jones Commodity Index. Besides that, check out palladium, an extreme case of dropping volatility, and any of the non-ferrous metals' five year charts in the two below links (the 2nd link to the non-ferrous metals takes you to zinc, but you can find any of the others in the sidebar on the left):
http://www.kitco.com/charts/techcharts_palladium.html
http://www.kitcometals.com/charts/zinc_historical.html