I think when you used VWAP incorrectly we really were a service to the children by explaining everything so listen up here--
- USE 80 NOT 70
- DON'T USE IS UP MARKET-
- NON TRENDING MARKET BEST FOR USE OF RSI--
US stocks are on pace for double-digit gains this year. The S&P is up roughly 18%, as of late November, after adding 8% thus far this month. Improving inflation data has sparked hopes of an end to the Fed's restrictive monetary policy. But some Fedspeak lately has indicated the US central bank may not be done raising rates just yet. That, plus concerning housing data and lingering geopolitical developments, could put some of this year's gains in jeopardy.
If you make shorter-term investing and trading moves, the relative strength index is an indicator that can help you evaluate which direction stocks may head over the short term. The gains that stocks have made this month have pushed RSI to an overbought reading, suggesting the November rally may lose some of its short-term momentum.
What is RSI?
Let's dive deeper into RSI so you can get a better sense of the signals that it can give. Essentially, RSI is used to determine whether an investment is overbought or oversold by measuring the speed and change of price movements. It's intended to evaluate the relative value of a stock, index, or other investment using recent price history.
RSI is a momentum oscillator, a type of technical indicator that fluctuates in a range, usually from 0 to 100.
It is calculated using the average gain and average loss over a defined period of time. Like other oscillators,
RSI is considered to be most applicable in non-trending markets (i.e., not clearly trending up or down).
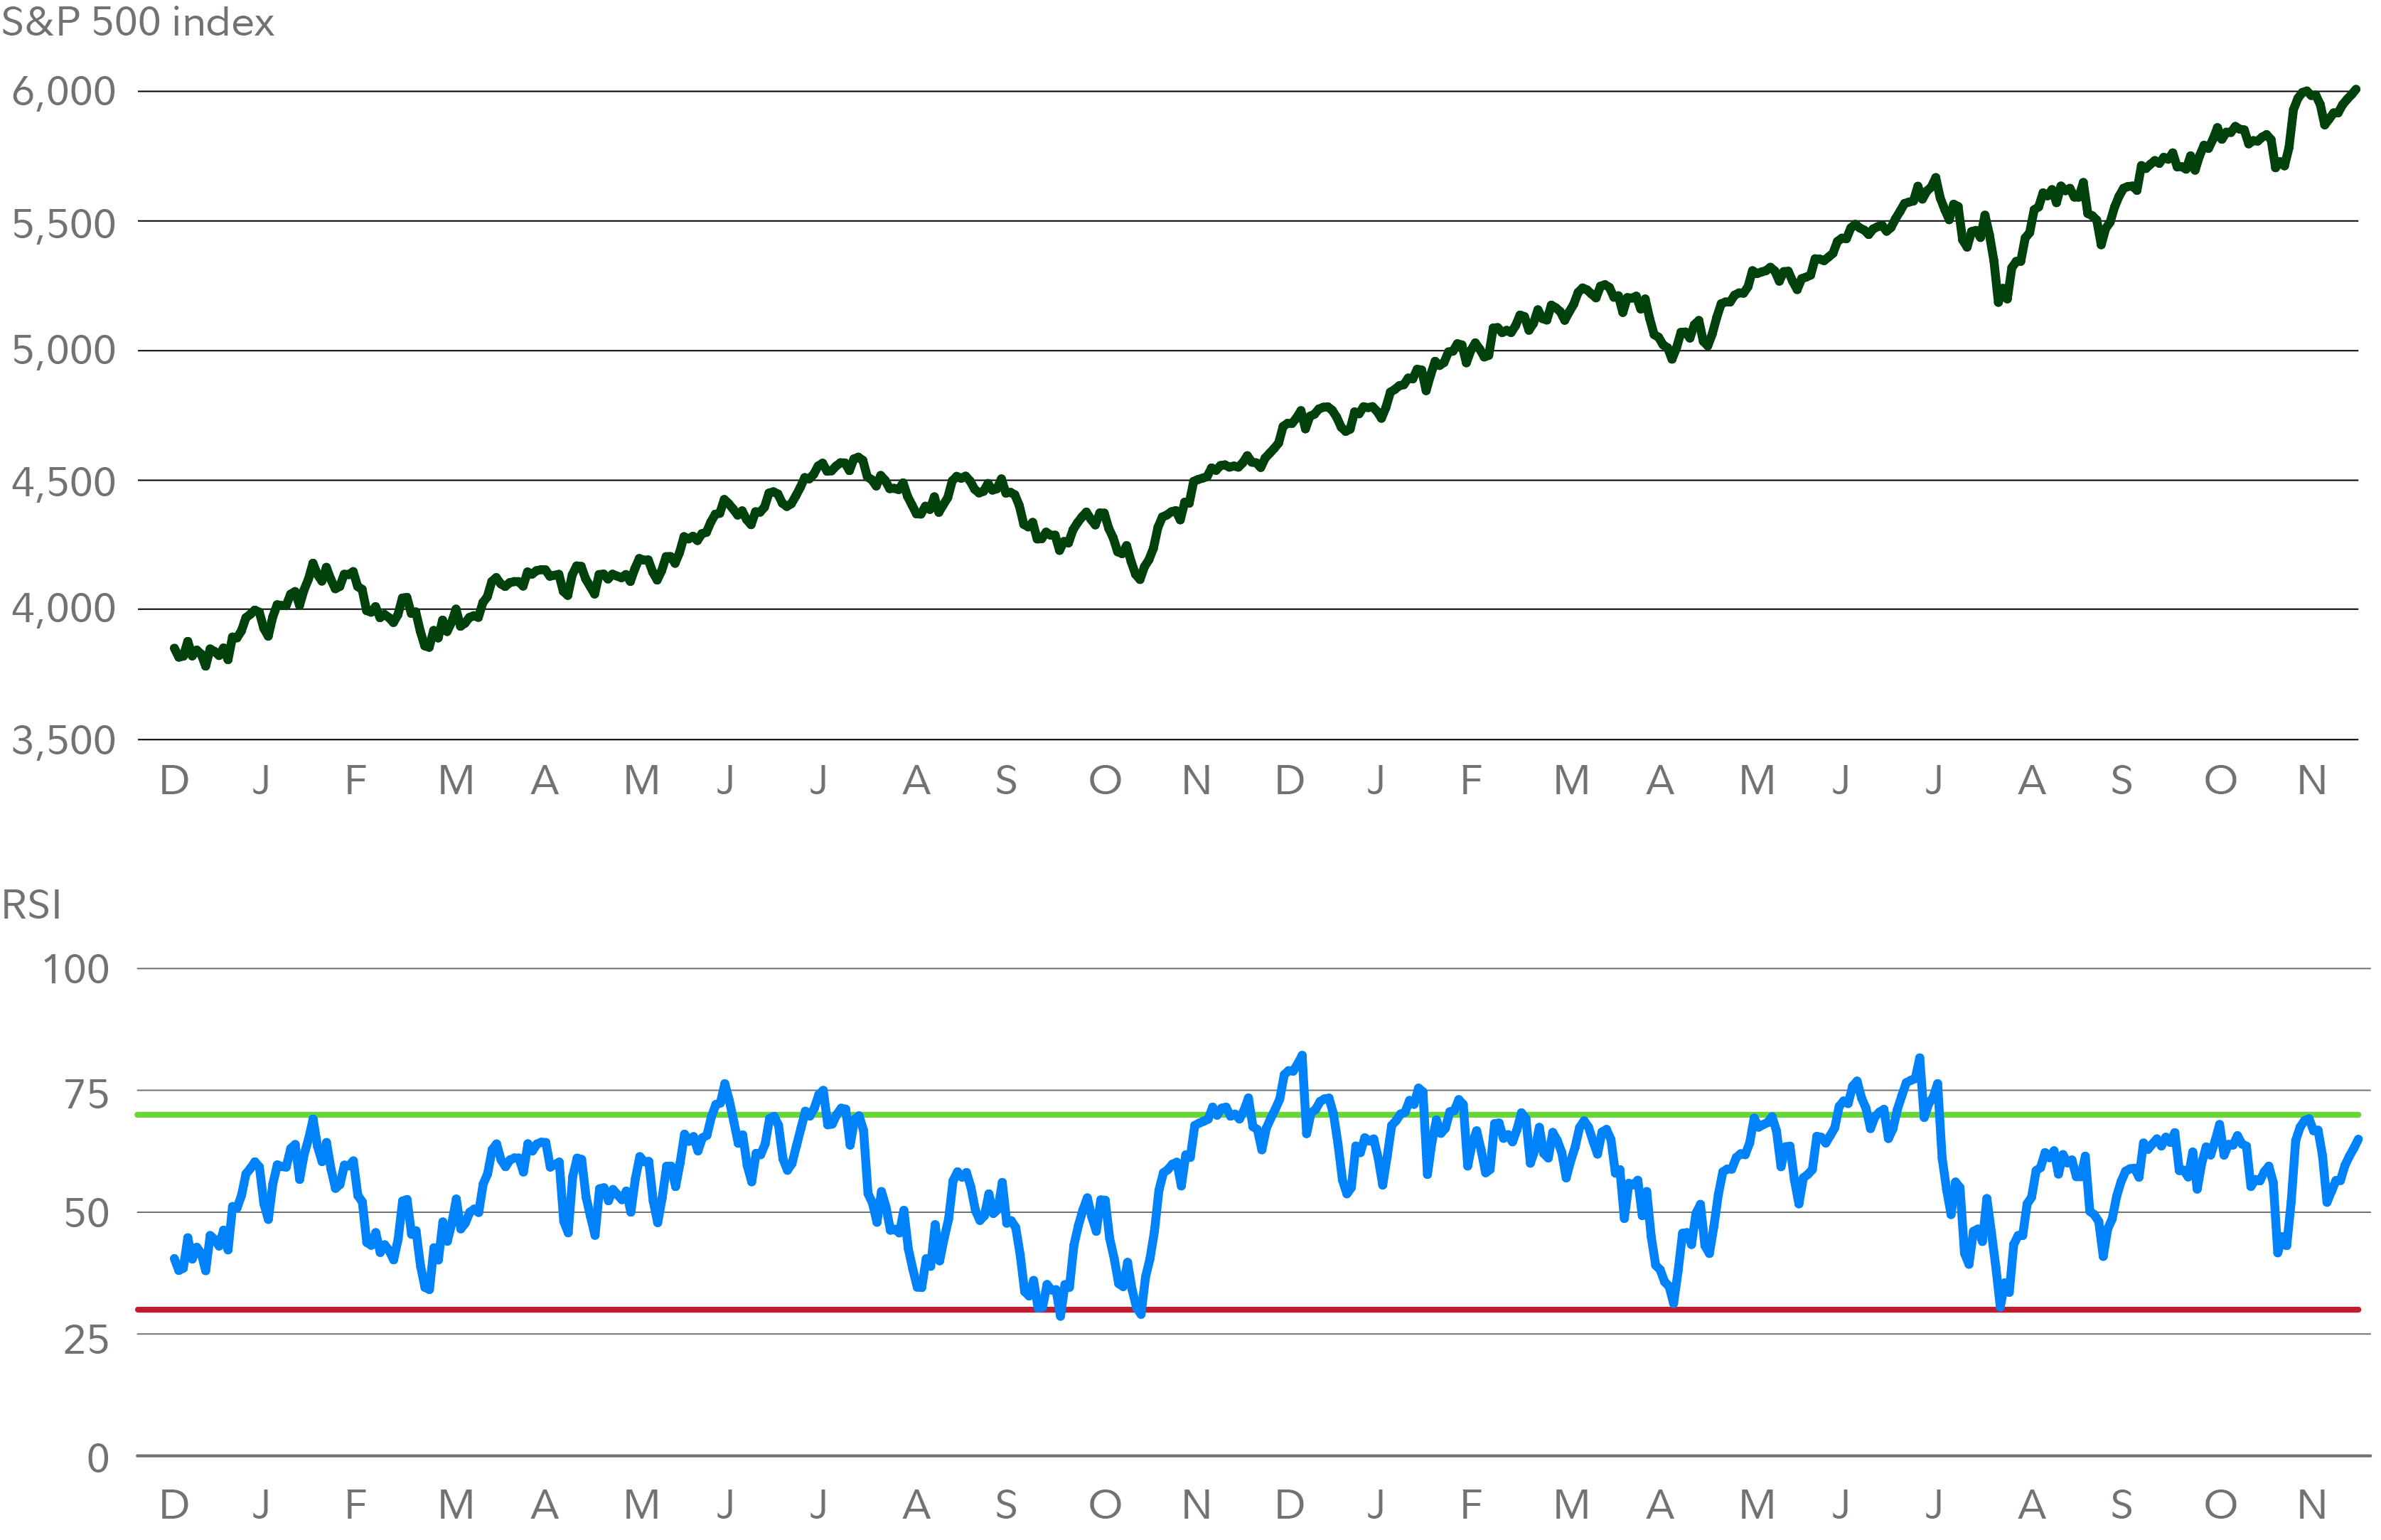
In the chart below, RSI is the blue line in the section below the S&P 500 price. Investors using RSI generally stick to a couple of simple rules. First, low RSI levels, typically below 30 (red line), indicate oversold conditions—generating a potential buy signal. Conversely, high RSI levels, typically above 70 (green line), indicate overbought conditions—generating a potential sell signal.
RSI applied to the S&P
Source: Active Trader Pro®, as of November 21, 2023. Screenshot is for illustrative purposes only. The data, charts, and information shown above are provided solely for individual use and are not for distribution. Data and information shown are based on information known to Fidelity as of the date it was exported and are subject to change. Criteria and inputs entered, including the choice to make security comparisons or to show technical event opportunities (if available), are at the sole discretion of the user.
Some RSI users adjust these rules based on their own preferences. Instead of using 30 and 70 as oversold and overbought levels, for example, one common modification is to widen the parameters
to 20 and 80. Here, if RSI were to drop to 20, that would generate a buy signal. Alternatively, if RSI were to r
ise to 80, this would generate a sell signal.
Trading signals generated by RSI are generally thought to be most valid when values reach an extreme reading near the upper or lower end of the boundaries. An RSI reading near 100 (the top of the RSI scale) would be greater evidence of overbought conditions (a sell signal), while an RSI reading near 0 (the bottom of the RSI scale) would suggest oversold conditions (a buy signal). Trading signals generated by RSI may also be given more credence when the reading rises above 70 and stays above that level for an extended period of time, or drops below 30 and stays below that level for an extended period of time.
What RSI says about stocks now
The chart of the S&P 500 above shows how stocks have recently recouped roughly all of their summer decline. That has helped put markets back on pace for a double-digit advance during 2023.
The November rally has also pushed RSI near 70—an oversold reading.
However, this doesn't necessarily generate a hard sell signal, especially for those that prefer to use the 80 RSI level as a sell signal line. It's also worth noting that
the S&P 500's RSI is not at extreme levels nor has it been trading above a sell level for very long. In sum, the recent gains for stocks have generated an RSI sell signal, but traders using RSI may want to monitor stocks for additional evidence of a stronger sell signal.
More uses of RSI
RSI can remain in overbought or oversold territory for an extended period of time (weeks or even months). That is, if RSI were to move above 70 or below 30, it would not be uncommon for it to remain above or below those levels for some period of time without retreating back to neutral RSI territory between 30 and 70 (or between 20 and 80, depending on the levels that you use).
In addition to the overbought and oversold signals that RSI can generate, it is possible to dig a little deeper into the relationship between RSI and the price action of the stock or index. A positive RSI reversal, for example, might occur when RSI makes a lower low (a relative low point on the chart that is below the most recent previous low) but the price is starting to make a higher low (a relative low on the chart that is higher than the most recent previous low). This would be a bullish move, generating a buy signal. A negative reversal could occur when RSI forms a higher high, but the price forms a lower high. This would be a bearish move, generating a sell signal. The S&P 500 has not recently exhibited a positive or negative reversal.
RSI in action
It should go without saying that you shouldn't trade on this indicator alone. RSI and other chart indicators should be used in conjunction with fundamental analysis, business cycle analysis, and any other information that aligns with your strategy. More importantly, trends in inflation, potential moves by the Fed, earnings results, and other factors have the power to override any chart trends. With that said, the charts may be giving a caution sign as we approach the end of 2023.
HOPE THIS HELPS!