Hi,
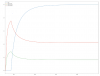
does anyone know why actual positions are really wild at the beginning of historical period? (See JPY below)
I wouldn't want to hold 100 contracts when trading a new instrument, so am trying to understand this effect.
Graphed using system.accounts.get_actual_position(instr).plot(title=instr)


Code to replicate, note I added JPY to my system...
from systems.provided.futures_chapter15.basesystem import futures_system
from matplotlib.pyplot import show
system = futures_system(log_level="on")
print(system.accounts.portfolio().sharpe())
#system.accounts.portfolio().curve().plot()
instr = system.get_instrument_list()[1]
instr = "JPY"
system.accounts.get_actual_position(instr).plot(title=instr)
show()
does anyone know why actual positions are really wild at the beginning of historical period? (See JPY below)
I wouldn't want to hold 100 contracts when trading a new instrument, so am trying to understand this effect.
Graphed using system.accounts.get_actual_position(instr).plot(title=instr)
Code to replicate, note I added JPY to my system...
from systems.provided.futures_chapter15.basesystem import futures_system
from matplotlib.pyplot import show
system = futures_system(log_level="on")
print(system.accounts.portfolio().sharpe())
#system.accounts.portfolio().curve().plot()
instr = system.get_instrument_list()[1]
instr = "JPY"
system.accounts.get_actual_position(instr).plot(title=instr)
show()