Fully automated futures trading

I've finally got round to producing a new backtest which can be found here

The bottom line is that the last year has indeed been exceptionally good, versus a realistic long run back tested Sharpe of 0.88.

2009, 2011 - 2013 are flat. However 2010 is more interesting, as my backtest made some money whilst the CTA industry generally didn't. I've done a bit more digging since I wrote that post and this is a further breakdown by trading rule:

plot.jpg


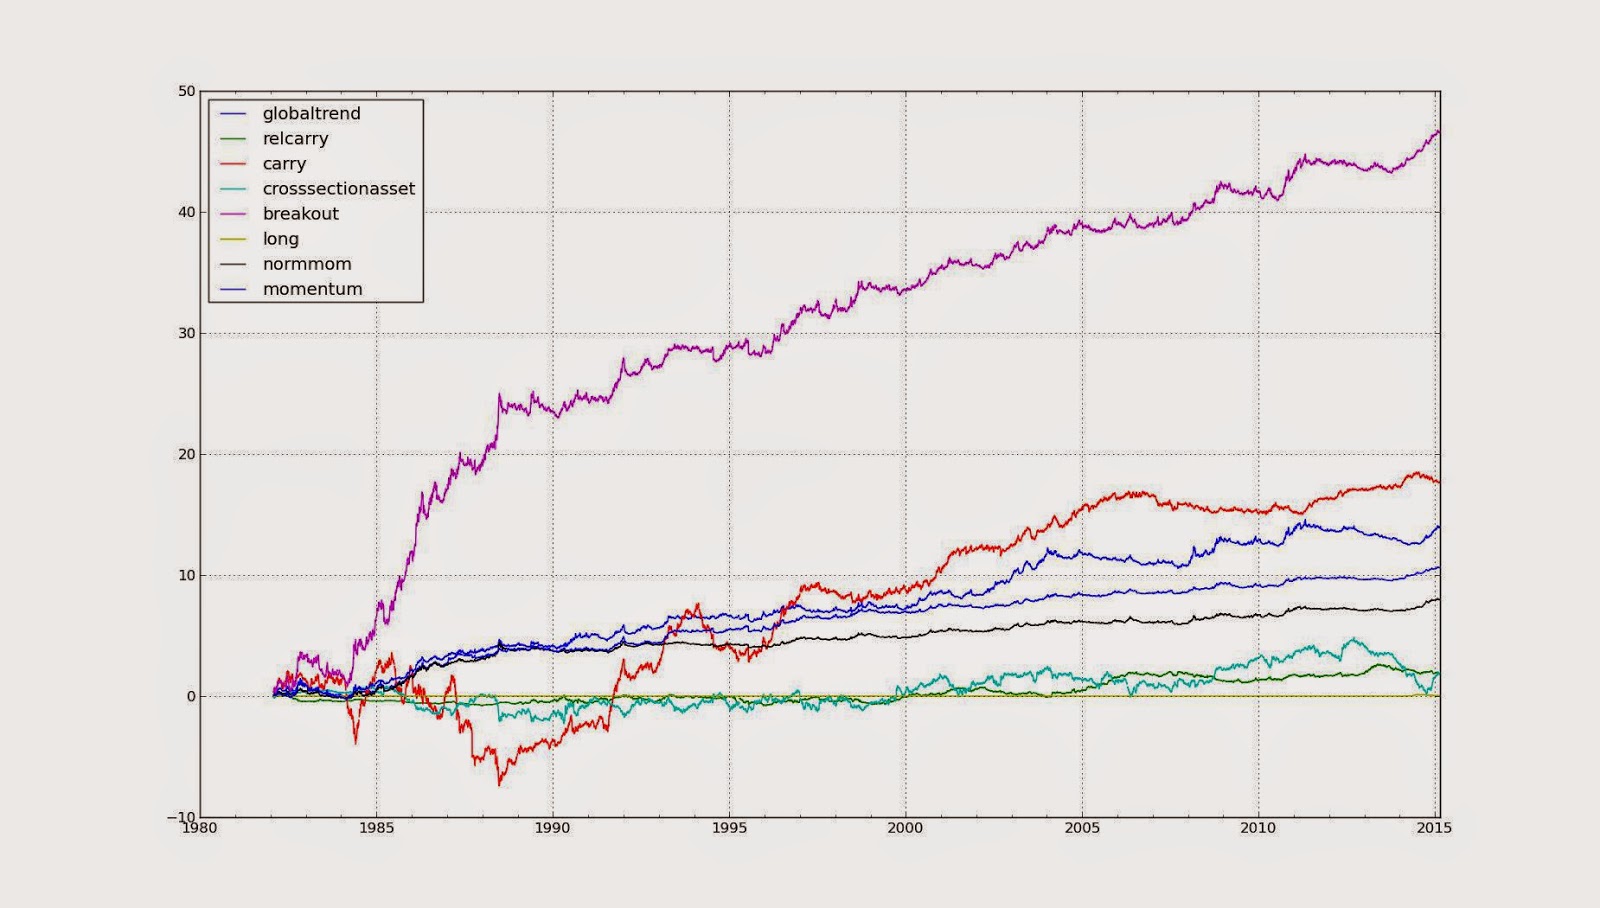
'globaltrend', 'breakout', 'normmom' and 'momentum' are different flavours of trend following. Although AHL (and I guess other CTA's) use similar versions of these rules (with the possible exception of 'normmom' which is my own entirely original, though very simple, creation) they don't have them in the same proportions as I do. In particular 'momentum', which is an EWMAC system, was a relatively large part of a typical CTA system in 2010*, wheras I have a more equal weighting. The highest blue line (below the red line) is this type of system, which did the worst in 2010.

This scale of outperformance may not be repeatable, but in general I think its better to have a spread of different kinds of trading rules rather than relying too much on one.

* I have no idea what the typical proportions are now.


Hi GAT,

What is the historical max drawdown for your system running at an annual vol target of 25% and the Sharpe Ratio?
 
Congrats to those results.

Question about "risk":

I can estimate individual position risk using the instruments volatility as a proxy:

risk = position_value * stddev(percent_instrument_return)

But how do you estimate the total account risk?
Just adding up all individual position risk values gives a too high number, essentially a worst case risk.
Is the sum of all position risk values divided by the Instrument Diversification Multiplier a good estimate?

Would using the account volatility under-estimate the risk?

"Is the sum of all position risk values divided by the Instrument Diversification Multiplier a good estimate?"

Not really. The IDM is a long run measure of the correlation between subsystems, not between returns on positions.

I just use standard risk measures assuming gaussian returns, eg http://faculty.washington.edu/ezivot/econ424/portfolioTheoryMatrix.pdf
and measuring correlation / vol over recent history (say a few months and a months lookback respectively).

GAT
 
Max DD 33%, sharpe about 0.9

GAT

It seems to me that max DD is a weird metric because it doesn't account for time. For longer time periods max DD is going to be larger simply because you're taking more samples of the random distribution. Put another way, as time approaches infinity, max DD is going to be 100% with probability 1.
 
It seems to me that max DD is a weird metric because it doesn't account for time. For longer time periods max DD is going to be larger simply because you're taking more samples of the random distribution. Put another way, as time approaches infinity, max DD is going to be 100% with probability 1.

Oh yeah it's a stupid statistic. The other thing I don't like is the fact that it's a single data point, so it's statistically highly non robust.

But people seem to want to know it. They should bear in mind that max DD isn't the maximum you can lose. You should assume that 100% is the maximum you should use.

GAT

PS I'm not sure if you're guaranteed to get to -100% if you're using proper capital scaling, but it's true that at an infinite horizon you'll see 99.999999% at some point.
 
GAT

I'm waiting on delivery of your book and downloaded your spreadsheet on ewma calculation of standard deviation. In the mean time i was wondering if you use the dollar change or percent change when calculating vol. Also, when the forecasted vol for today do you calculate the ewma for the entire series or just the last N samples of price or percent change?

It depends on what I'm using the vol for, sometimes I use %, sometimes price.

You don't need to use the whole series; something like 5 times the length of the EWMA lookback will give you an accurate enough answer.

Rob
 
It depends on what I'm using the vol for, sometimes I use %, sometimes price.

You don't need to use the whole series; something like 5 times the length of the EWMA lookback will give you an accurate enough answer.

Rob
I've always used log change in creating a covariance matrix. Under what circumstance(s) would you use price rather than price change? Also, would you use ewma in calculating correlation as well?
 
I've always used log change in creating a covariance matrix. Under what circumstance(s) would you use price rather than price change? Also, would you use ewma in calculating correlation as well?

Sorry I should have said, sometimes I use % price, sometimes delta (price). I think log change will give you similar results to % price (I also think you mean change(log(price)), rather than log (change)!) I use this for position scaling.

The latter is useful for scaling trading rules, eg EWMAC = EWMA_fast - EWMA_slow / vol( delta_price)

This is explained in the book, appendix B.

Correlations - sure you can use exponential weighting of correlations. Again normally % would be appropriate here.

Rob
 
Back
Top