Hi Hero,
Still plugging along at it eh? I was a lurker back in the day and learned a lot about the p/v relationship. One is about the counter intuitiveness of p/v and another is that going from 2-3 happens on decreasing volume. Good luck!
A brief overview.
On the otherhand, middles of trends, where price moves for the making of money, is controlled by the minority. Watch the DOM and the direction of movement. It comes about by market orders CONSUMING limit orders on the smaller side of the bid and offer sides.
All of this is COUNTERINTUITIVE.
You have learned that measuring volume gives you the order of events in the middle between two ends.
You are using an out of date browser. It may not display this or other websites correctly.
You should upgrade or use an alternative browser.
You should upgrade or use an alternative browser.
Fractal Theory: Redux
- Thread starter llIHeroic
- Start date
Hi tiddlywinks,
In your advice above, are you using "volume bands" as another phrase for market pace lines similar to the chart Mak posted years ago or are you referring to Jack's "A thru K volume bands" as described in the "Market System of Operation" thread a few years back?
-river
Hi river. A-K bands is what I was referring to. The "band aids" image when applied, gives A-K their purpose. I've attached "bandaids" and another similar(much cleaner) image I found somewhere as well.
Keep in mind, as P's & T's develop, so do the bands. JH basically used stationary A-K, based on a calendar quarter or so of historics. And that was used to "evaluate" dynamic PRV numbers. I've done a lot of work with PRV. Even traded live for a month using bar by bar PRV instead of actual volume. What I use today is dynamic A-K, based on dynamic (bar by bar) PRV. A-K are different (almost) everyday. This melds great for me, with the dynamics of P's & T's.
Hopefully, something in the above will ignite a thought or a process that will propel you.
Attachments
If the rules are clearly established, I would be willing to code and share it with all those who contribute. I have reliable futures data going back 5-10 years, so plenty of data to back test.
We will know for sure if it works or not. Data does not lie")
The platform would be NinjaTrader.
We will know for sure if it works or not. Data does not lie
The platform would be NinjaTrader.
Purely from a no man is an island standpoint, I'd be willing to participate. I use Sierrachart, and am very proficient coding. But like @RedDuke said, what is to be coded, must be clearly defined. This is critical working with multiple contributors. Otherwise, it's a huge waste of time for the one coding.
With that, a reminder that there is a JH software thread here in ET. A poster, @Stephen, I think, created a whole suite of JH stuff for NinjaTrader. He also updates. There are also a few studies for Sierrachart, and other miscellaneous snips in there. Just saying.
EDIT: Here's a link to the JH Software thread... https://www.elitetrader.com/et/threads/software-used-to-trade-jack-hershey-methods.97684/page-154
The user name I mentioned should be @stepan7, not stephen. Sorry.
Last edited:
Timeframe is a user preference -OR- an optimization that comes from testing. Developing a system for a specific timeframe is not something I am interested in, and Im sure others would agree. When JH developed his stuff, 60 handle days NEVER occurred. Additionally, charts, forget timeframes other than daily or weekly, were maintained by hand. Portions of JH have stood the test of time, which is partially responsible for continued interest and ongoing refinement.
Trading hours is a user preference dictated by the trading instrument -OR- an optimization that comes from testing. Developing a system for specific trading hours or a specific timezone is not something I am interested in, and I'm sure others would agree.
Ehorns approach, as pictured in the links you supplied, is nothing but the basics of JHPV. The 10 cases, a tape, and some sort of guassian and band stuff. Unless you know how Ehorn uses/used that information, it is not a system, it is merely the concepts of JHPV displayed on a screen.
As Mark Cuban would say on Sharktank... I'm out.
Good luck.
ehorn appeared to have fully automated the drawing of channels and Gaussians in Ninjatrader in 2010. See this image:
http://cdn3.traderslaboratory.com/f...-price-volume-relationship-es-5m-05242010.png
http://cdn3.traderslaboratory.com/f...-price-volume-relationship-es-5m-05242010.png
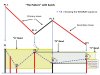
Nice to hear from you guys. You guys both demonstrate a good point; this method has an elusive quality to it. Despite the mechanical foundation which the method utilizes, complete objectivity may be impossible to come by. So many times there are multiple possibilities simultaneously on the board before the market gives enough information to provide certainty; and if you were waiting for it then you missed the train a while back. I could even see a third trend configuration from this image that appears to be valid, at least from the data shown.
For a long time I personally was reading an assertion of a reasonable degree of certainty from jack and Spyder's posts over the years, which I have grown increasingly skeptical of such being offered by this paradigm as I've continued to study and apply it. Perhaps it's an interpretation bias on my part, or maybe there is some essential component that has continued to remain beyond my ability to grasp.
I too would've liked to see some real-time analysis from some of the highly successful traders of this system. I don't doubt it's possible; but there seems to be some ephemeral quality that really sets a few individuals apart from the rest. One time I was comparing my trades to jack's blotter for the morning. We took the same short, but I exited it after a certain spike when everything seemed to be complete and his set of guidelines at the time even specified an exit. Jack held it through the exit signal and it went down another decent run of points.
When I asked him how I could've known not to exit there; his reply was essentially, "You've just got to look at the YM, and look at the T&S, and know that a reversal wasn't possible at that point." So I'd say over time I've become a lot less ferocious in perfecting this method; stepped back [whether correctly or incorrectly] to viewing it more as a framework for interpreting market sentiment, and began to focus on developing intuitive awareness over mechanical application.
I've had a few really good runs at times, but to this day I'd label my trading as marginally successful on the whole. Nothing like the extreme success JH, Spyder, and a few others have apparently produced. I have a relatively comfortable job and life; so trading remains a side-project for me when I've got the time and energy for it, unless or until I am able to generate a high and consistent enough level of income for a more concentrated allocation of my time and efforts toward it to make sense.
To say that Jack could be a bit on the cryptic side would be an understatement. What he's talking about with the YM reference, IMO, is that if YM showed anything but a completed 3rd leg, then one should hold. The T&S stuff is beyond my ken but I have no doubt that Jack meant what he said.
In my experience, YM tends to show 1,2,3 more obviously/frequently than ES, which of course shows 1,2,3 as well, but IME, it can be a bear at times to pull it out. I don't trade YM but do use it to key off for an ES trade.
If the rules are clearly established, I would be willing to code and share it with all those who contribute. I have reliable futures data going back 5-10 years, so plenty of data to back test.
We will know for sure if it works or not. Data does not lie
The platform would be NinjaTrader.
Oh,that...Go ahead and code and share it,please.That should be fun!
I have some stuff as well.This one is the Volume ID`ed nodes:

To say that Jack could be a bit on the cryptic side would be an understatement. What he's talking about with the YM reference, IMO, is that if YM showed anything but a completed 3rd leg, then one should hold. The T&S stuff is beyond my ken but I have no doubt that Jack meant what he said.
In my experience, YM tends to show 1,2,3 more obviously/frequently than ES, which of course shows 1,2,3 as well, but IME, it can be a bear at times to pull it out. I don't trade YM but do use it to key off for an ES trade.
Thanks for weighing in. I think you underscored one of the biggest keys to this method; finding reasons to hold. If someone enters on an FTT, no matter what bar interval, the ratio of the potential loss to the point where your hypothesis is proved wrong with certainty vs. the potential length of the x2x2y2x sequence you're holding is extremely favorable.
I think I mentioned before, but I always think back to the old charts pre-2008 or so. They were extremely unpolished and often lacking in basic fractal integrity, yet there was a good number of traders making consistent profits off them. A decently annotated chart almost trades itself, at least in theory.
The last hurdle I've been facing for some time is how to stop my emotions from severely degrading my edge. The results in sim I consistently put up are really substantial. Most days I can trade small size like 1-2 contracts a little worse for wear but still decent. But every once in a while I over-trade, get sloppy with entries/risk, or just make plain, uncharacteristically bad reads on context and give back a lot more profit than I should.
I keep wanting to think a positive backlog of 100+ trades over weeks on end would give me enough comfort and confidence to stay the course and make solid decisions with live trades on but for some reason I just slip into old habits every once in a while. I guess I'm still lacking in some degree of self-knowledge and/or the ability to anticipate poor trading days and just sit them out. Anyone else with sustained success have difficulties like this on the cusp of the profitability barrier?
I mean; the total equity is still decent. But take a look at just the past week including today. It just ugly, and it makes me feel unpleasant. It isn't even from poor market conditions or a bad event, just really bad trading.