
You are using an out of date browser. It may not display this or other websites correctly.
You should upgrade or use an alternative browser.
You should upgrade or use an alternative browser.
Fishy Poker
- Thread starter heavenskrow
- Start date

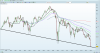

How do you know for certain that it's a dead cat bounce?
I would expect a dead cat bounce in nature to be much more fast and sharp, rather than create an area of balance and then move higher.
Are there any key notes of a dead cat bounce that I should be aware of?
I mean one thing that is still having me on my feet is the weakness in China as well as the strength in the 30yr Treasuries. And that bank stocks based on complex H&S patterns, have hit it's mid-level support and rallied, but still have one more area of support that should hit before we give more of a probability that the move has bottomed.
Well, according to Dow Theory (which worked fine for the past 120 years), S&P is in bear market : high, new low lower, new high lower, new low lower.
Moreover, we are well below 200d MA, and 200d MA is declining.
You don't need to be an expert to understand game is over for 2016.
After 6 years of non-stop bull market, could you imagine bear market that would last only 6 months ? Probabilities are low.
So more pain to come.
That is why we are talking about a classic dead cat bounce. Not a V bottom.
Maybe SP could target 2000 ? 2020 ?
But after, probabilities are high for a lower bottom (1740 ? 1700 ? 1600 ??).
Bears are awaken, and they are hungry.
So don't anticipate. If you want to be long tomorrow, go, but don't be greedy, odds are clearly not in your favor for the coming days. I would rather wait toppish signs to short again.
CM
If you bulls manage to take out today's high, you guys win. Past 2 trading sessions and today has been absolutely insane even though I managed to short right at top tick(Chat archive). Too much chop lately. I am about to pull out my hair....and if the market takes out today's high, I give up trading.
I still remain convinced market is going down further. Huge spike up's in the close and open seem VERY VERY FISHY to me. It reminds me of the tape somewhat near June/July 2015 when market was at important support levels but some idiot with big money keeps buying at support and the market kept ripping off lows.
A real low in my opinion would be climax selling, then stealth buying with a higher low. These spike up on the long side seem fishy as hell. And if the market does end up taking out today's high....well you guys win. I will give up trading for a while....and go back to a day job.
I remain short through QQQ puts, Biotech shorts, Financials shorts,...
Silver/Gold miners seem interesting for a long after a pullback from the first surge of buying in January.
If I should be seeing something as bullish that I am not seeing, let me know I am always open eyes and ears from the other side.
I still remain convinced market is going down further. Huge spike up's in the close and open seem VERY VERY FISHY to me. It reminds me of the tape somewhat near June/July 2015 when market was at important support levels but some idiot with big money keeps buying at support and the market kept ripping off lows.
A real low in my opinion would be climax selling, then stealth buying with a higher low. These spike up on the long side seem fishy as hell. And if the market does end up taking out today's high....well you guys win. I will give up trading for a while....and go back to a day job.
I remain short through QQQ puts, Biotech shorts, Financials shorts,...
Silver/Gold miners seem interesting for a long after a pullback from the first surge of buying in January.
If I should be seeing something as bullish that I am not seeing, let me know I am always open eyes and ears from the other side.
Last edited:
Chris it looks like the market gave us a huge opportunity on Feb 1st and also today's pop in the morning. You are one of the only guys on here who has been short with me in biotech. We need to link up sometime, great minds think alike. =]Well, according to Dow Theory (which worked fine for the past 120 years), S&P is in bear market : high, new low lower, new high lower, new low lower.
Moreover, we are well below 200d MA, and 200d MA is declining.
You don't need to be an expert to understand game is over for 2016.
After 6 years of non-stop bull market, could you imagine bear market that would last only 6 months ? Probabilities are low.
So more pain to come.
That is why we are talking about a classic dead cat bounce. Not a V bottom.
Maybe SP could target 2000 ? 2020 ?
But after, probabilities are high for a lower bottom (1740 ? 1700 ? 1600 ??).
Bears are awaken, and they are hungry.
So don't anticipate. If you want to be long tomorrow, go, but don't be greedy, odds are clearly not in your favor for the coming days. I would rather wait toppish signs to short again.
CM
And in regards to Dow Theory, I need to restudy it. It was one of the first things I learned on my own back in uni days but stopped using it on a daily basis. If we break the neckline, I see at least a move down to 1660.
Thank you for keeping me in check and not wishy washy as the ES and YM holds above support. I appreciate your analysis!
Chris it looks like the market gave us a huge opportunity on Feb 1st and also today's pop in the morning. You are one of the only guys on here who has been short with me in biotech. We need to link up sometime, great minds think alike. =]
And in regards to Dow Theory, I need to restudy it. It was one of the first things I learned on my own back in uni days but stopped using it on a daily basis. If we break the neckline, I see at least a move down to 1660.
Thank you for keeping me in check and not wishy washy as the ES and YM holds above support. I appreciate your analysis!
Thanks Heavenskrow, much appreciated.
Dow Theory is a classic, but I would rather recommend you to study "Understanding Price Action" from Bob Volman. That could give you some insight in order to play modern markets.
Today, we made a new annual low with the S&P future : 1802.50. (quoted 1808 right now...)
But beware, this is not a real low, if we don't make a new low below 1800, this could be a fake low aka "bear trap". Lots of people began to short during these last days, and the game is ripped : few should benefit from the freefall of the markets. A vicious rebound could take place at any time. Today, I took profits from my shorts, maybe it is a mistake, but no need to be greedy.
And if we don't make a new low, we could imagine a strong counter-trend for the coming days, maybe +10% in the US and Europe.
Be ready to short heavily at this time. We keep in touch
 .
.CM
Holy macro, this week of 2/8-2/11 has been absolutely insanity. No matter how many people on here and other forums tell me there is no "them" I still believe there is a "them aka Mr. Bullshit". I refuse to believe the bullshit that the market at once will all just ramp/spike in the open and close at the same exact time.
While everyone was sheep'd into watching a boring Super Bowl 50 with Cam Newton getting tilted and costing him the game....overnight Sunday there was a major selloff in markets.
Monday starts the trading session with piercing support, retesting prior support now as resistance, selling off, then a huge wave of buying into the close by Mr. Bullshit to have the ES close above major support.
Overnight Monday there is more bad news from EU and Japan, and after an attempt higher...the market sells off into U.S. open. When U.S. opens Tuesday, Mr. Bullshit comes in again and spikes it back above major support on ES. Chop up and down all day to make a higher low than the open and Mr. Bullshit comes back in the close to keep the ES above major support.
Overnight Tuesday there is optimism from Deutsche Bank that everything is fixed or okay....U.S. markets open Wednesday with them all up 1%+, dumb shorts are about to give up. Then Yellen starts testifying before Congress and there is a rush to buy. Almost everyone on ET chat was convinced the markets going higher, but being the outcast and seeing a setup I have not seen since Feb 1st, I added to my shorts top tick despite the painful week so far of Mr. Bullshit ramping it up in the open and close.
Then suddenly the market changes.....it feels like truth. It just goes down and down.....forms a short term reversal pattern, I unfortunately give in to the short term reversal pattern and cover some of my shorts. After a lower high, market chops into abyss for 2-3 hours, and into the close sells off. Finally I am being rewarded for 3 days of torture.....
Then overnight Thursday, Asia tanks with Gold surge from Hong Kong buyers. I am still short Nikkei futures so I am happy. However at 4am, I see a great level to cover but cannot liquidate because the Japanese market is on a holiday!! Just my luck, I hope and pray it doesn't blast higher from there....go back to bed for 2 hours sleep.
Market opens Thursday with desperate traders like me wanting to cover, it surges higher. My Nasdaq puts are frustrating me as while all the other indicies are below Monday low, the Nasdaq which was weakest is now getting stronger. I sell my vxx calls and vxx long positions near the open since my target level was hit and I do not want to be a greedy pig. However I remain holding onto my Nasdaq puts and other shorts. Nasdaq again is wanting me to rip out my hair......what was once the weakest indicie is now the strongest, just my luck. It breaks resistance levels I did not want it to break....
However just like this whole week, I believe Mr. Bullshit has been trying desperately for traders to sell their shorts and make them cover. I have desperately held on every attempt to cover and it has paid off. If I had to go through that much torture to disguise the real market wanting to go lower...the reward(just 1 day) was not justified for the torture of ramp ups in the open and close. Thus while Thursday short term targets in volatility were hit and some indexes have held key support, the ES finally has a daily close below very important support.
Mr. Bullshit has definitely gave me gray hair but for this week, so far I have prevailed. However as of currently Thursday night, I am still a scared bear. These ramps ups are so frustrating to deal with, and I can't remain too convinced on the downside. Now for tomorrow I am suspecting based on these poker plays by the market, no more bullshit by Mr.Bullshit and the real move comes down. Or Mr. Bullshit prevails, and makes me cover all my shorts and close the week above major support. Best thing to do tomorrow is be prepared, flexible, and open minded....be like water my friend.
While everyone was sheep'd into watching a boring Super Bowl 50 with Cam Newton getting tilted and costing him the game....overnight Sunday there was a major selloff in markets.
Monday starts the trading session with piercing support, retesting prior support now as resistance, selling off, then a huge wave of buying into the close by Mr. Bullshit to have the ES close above major support.
Overnight Monday there is more bad news from EU and Japan, and after an attempt higher...the market sells off into U.S. open. When U.S. opens Tuesday, Mr. Bullshit comes in again and spikes it back above major support on ES. Chop up and down all day to make a higher low than the open and Mr. Bullshit comes back in the close to keep the ES above major support.
Overnight Tuesday there is optimism from Deutsche Bank that everything is fixed or okay....U.S. markets open Wednesday with them all up 1%+, dumb shorts are about to give up. Then Yellen starts testifying before Congress and there is a rush to buy. Almost everyone on ET chat was convinced the markets going higher, but being the outcast and seeing a setup I have not seen since Feb 1st, I added to my shorts top tick despite the painful week so far of Mr. Bullshit ramping it up in the open and close.
Then suddenly the market changes.....it feels like truth. It just goes down and down.....forms a short term reversal pattern, I unfortunately give in to the short term reversal pattern and cover some of my shorts. After a lower high, market chops into abyss for 2-3 hours, and into the close sells off. Finally I am being rewarded for 3 days of torture.....
Then overnight Thursday, Asia tanks with Gold surge from Hong Kong buyers. I am still short Nikkei futures so I am happy. However at 4am, I see a great level to cover but cannot liquidate because the Japanese market is on a holiday!! Just my luck, I hope and pray it doesn't blast higher from there....go back to bed for 2 hours sleep.
Market opens Thursday with desperate traders like me wanting to cover, it surges higher. My Nasdaq puts are frustrating me as while all the other indicies are below Monday low, the Nasdaq which was weakest is now getting stronger. I sell my vxx calls and vxx long positions near the open since my target level was hit and I do not want to be a greedy pig. However I remain holding onto my Nasdaq puts and other shorts. Nasdaq again is wanting me to rip out my hair......what was once the weakest indicie is now the strongest, just my luck. It breaks resistance levels I did not want it to break....
However just like this whole week, I believe Mr. Bullshit has been trying desperately for traders to sell their shorts and make them cover. I have desperately held on every attempt to cover and it has paid off. If I had to go through that much torture to disguise the real market wanting to go lower...the reward(just 1 day) was not justified for the torture of ramp ups in the open and close. Thus while Thursday short term targets in volatility were hit and some indexes have held key support, the ES finally has a daily close below very important support.
Mr. Bullshit has definitely gave me gray hair but for this week, so far I have prevailed. However as of currently Thursday night, I am still a scared bear. These ramps ups are so frustrating to deal with, and I can't remain too convinced on the downside. Now for tomorrow I am suspecting based on these poker plays by the market, no more bullshit by Mr.Bullshit and the real move comes down. Or Mr. Bullshit prevails, and makes me cover all my shorts and close the week above major support. Best thing to do tomorrow is be prepared, flexible, and open minded....be like water my friend.
Amazing call CM! that 1802.5 low coincided with key levels in the majors(resistance for VX) with Japan support levels holding. My frustration of strong buying overtook me in the past 3 trading sessions leading to the "bear trap" low. Should have covered with you.Thanks Heavenskrow, much appreciated.
Dow Theory is a classic, but I would rather recommend you to study "Understanding Price Action" from Bob Volman. That could give you some insight in order to play modern markets.
Today, we made a new annual low with the S&P future : 1802.50. (quoted 1808 right now...)
But beware, this is not a real low, if we don't make a new low below 1800, this could be a fake low aka "bear trap". Lots of people began to short during these last days, and the game is ripped : few should benefit from the freefall of the markets. A vicious rebound could take place at any time. Today, I took profits from my shorts, maybe it is a mistake, but no need to be greedy.
And if we don't make a new low, we could imagine a strong counter-trend for the coming days, maybe +10% in the US and Europe.
Be ready to short heavily at this time. We keep in touch
CM
- However I am still bearish in medium longer term view and waiting for another shorting opportunity.
HS, I agree, this is still bear. Be ready to short this week, or beginning of next week, follow the NASDAQ. If it goes above 4100, don t fight, wait 4200 or close ( strong sell). Next leg down should be ugly.Amazing call CM! that 1802.5 low coincided with key levels in the majors(resistance for VX) with Japan support levels holding. My frustration of strong buying overtook me in the past 3 trading sessions leading to the "bear trap" low. Should have covered with you.
- However I am still bearish in medium longer term view and waiting for another shorting opportunity.
Best strat I think is to buy out of the money put, half February (expiration end of week), half March. Good trades.
CM
CM, I ended up buying some puts on NQ on 2/17/2006 near the close as it came into a resistance I have set up for myself based on previous support from the lows.
One thing I found fishy last week was the retest of prior resistance that has now become support for Gold in it's huge run up. Also ZB's strength in a daily spike reversal candle and H&S formation.
I picked up some VXX calls near the close on Friday despite the tape going almost nowhere for the past few trading sessions. One thing that caught my attention is as soon as I bought the VXX calls, volatility spiked up even when markets hardly went down.
Of course VXX unfortunately returned to it's prior spike level....but something to note for this journal. One thing is for certain....the market saw what I saw, but let's see how it plays out....the resiliency in the indexes are something to be noted.
Anyways on an intraday time frame ES, TF, and NQ are still under resistance levels I have set for myself. The YM on the other hand is showing amazing strength making a higher low and even breaking out of resistance. Didn't Dow Theory need confirmation from the YM if the Dow Transports was showing a different sign?
For disclosure I am currently long some mexican food companies such as CMG and LOCO. Also long coal through KOL. And I am hoping for a further pullback in a certain commodity to buy some more positions.
One thing I found fishy last week was the retest of prior resistance that has now become support for Gold in it's huge run up. Also ZB's strength in a daily spike reversal candle and H&S formation.
I picked up some VXX calls near the close on Friday despite the tape going almost nowhere for the past few trading sessions. One thing that caught my attention is as soon as I bought the VXX calls, volatility spiked up even when markets hardly went down.
Of course VXX unfortunately returned to it's prior spike level....but something to note for this journal. One thing is for certain....the market saw what I saw, but let's see how it plays out....the resiliency in the indexes are something to be noted.
Anyways on an intraday time frame ES, TF, and NQ are still under resistance levels I have set for myself. The YM on the other hand is showing amazing strength making a higher low and even breaking out of resistance. Didn't Dow Theory need confirmation from the YM if the Dow Transports was showing a different sign?
For disclosure I am currently long some mexican food companies such as CMG and LOCO. Also long coal through KOL. And I am hoping for a further pullback in a certain commodity to buy some more positions.
Attachments
HS, good job!CM, I ended up buying some puts on NQ on 2/17/2006 near the close as it came into a resistance I have set up for myself based on previous support from the lows.
One thing I found fishy last week was the retest of prior resistance that has now become support for Gold in it's huge run up. Also ZB's strength in a daily spike reversal candle and H&S formation.
I picked up some VXX calls near the close on Friday despite the tape going almost nowhere for the past few trading sessions. One thing that caught my attention is as soon as I bought the VXX calls, volatility spiked up even when markets hardly went down.
Of course VXX unfortunately returned to it's prior spike level....but something to note for this journal. One thing is for certain....the market saw what I saw, but let's see how it plays out....the resiliency in the indexes are something to be noted.
Anyways on an intraday time frame ES, TF, and NQ are still under resistance levels I have set for myself. The YM on the other hand is showing amazing strength making a higher low and even breaking out of resistance. Didn't Dow Theory need confirmation from the YM if the Dow Transports was showing a different sign?
For disclosure I am currently long some mexican food companies such as CMG and LOCO. Also long coal through KOL. And I am hoping for a further pullback in a certain commodity to buy some more positions.
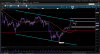
I agree, there are some divergences in the US indexes, we can have some doubt, the game would be too easy if not. But be sure everything should go in the same direction. And it comes closer and closer, we need to be patient.
What could be the triggers?
NASDAQ below 4000
SP below 1800
EURUSD above 1.13.
Gold above 1270.
In the meantime, it is probable we face a waiting period. For example, a large trading range for NQH6 : 4000 / 4200. Remember there is a lot of people who don t want a bear market continuation. They are ready to buy at any cost. So no hurry to fight, let them be exhausted. Be ready to buy more puts, this is a question of days, maybe hours? You got a nice graph, follow your S/R, they make sense.
Good trades for this important week! Lot of opportunities I think.
Stay focus my friend, there will be adverse movements because of the volatility !
CM