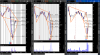
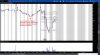
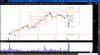
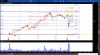
Vanzandt, interesting question. I looked at the chart and saw that the Fibonacci certainly did apply, though not necessarily in the last three days. I drew extensions from high/low points over the past couple of weeks and found that they were quite relevant Here's the chart:
Cool, we have a chart. Looking at the the timescale one could number them from the first bar we see. Bar 1. Bar 2 is also 6/5. Using this convention, the points accentuated in price action occur at Bar 5,7(6/12),15,20,23,24,25.
July 3rd translates to Bar22.
How did one know at Bar23 (the bar before the gap down) that the gap down was coming?
What other scenarios would the Fibonacci have anticipated at Bar23?
Given the current points defined and accentuated with the current level of annotation what is anticipated from today's bar forward?
@MACD
How would you expand this view into three timeframes?