Fibonacci works due to self fufilling prophecy or becuz 618 is embeded in humans?

Back to the idea of trading bar-by-bar.

Perhaps you are referring to the method by Al Brooks in his books and chatroom. I have a student that is a fan of Al Brooks and pays approximately $300 per month to be in his chatroom. The bottom line is that it Does Not Work. Perhaps you were not referring to that method of being able to anticipate the direction of the next bar or market trend by reading the charts (oftentimes tick charts) "bar by bar". Many so-called Trading Gurus profess that they can make market predictions by using Candlestick formations or patterns and others that base their system based on the position of what a bar that is higher than the 2 surrounding bars. That method has been sold under a number of different names. (Garbage In -- Garbage Out). Not sure what you wish to gain by "bar by bar" analysis.

On the 5min, is there a Fibonacci tool to anticipate the next bar?

The Fibonacci "Tools" are just Drawing tools, that are Free on most Charting Packages. You will have some idea as to anticipating "the next bar". It is possible that you would be able to predict the next 5 min bar if you are using a trading system which uses the fibs and a 5, 15 and 30 min charts. I can demonstrate that with lots of effort on this using multiple pictures or could prepare some video of my doing it live. So it does provide that look and anticipation of the "next bar". The question is how that is going to assist in trading profitably. Do you get in and out of a trade with 1 bar on a 5 min chart as a result of what the next bar is?

I can send you or you can find the Brooks book for free it has been posted on the internet by a broker.

How many bars are the minimum to get the reference points to use the tool?

Depends on why you want to know that? Really? Yes sometimes, you may neat to predict your targets or if using stops, where to locate your stops. If you are looking for an entry that will be determined by the fibs based on how long you anticipate being in the trade. Scalp for 10 minutes, Swing for 2 hours or even Position for Days. The Duration (which most traders disregard no matter what their method of trading) Is important. Generally only 2 points are needed. Number of Bars is not the determining factor it is picking Significant Highs and Lows (Peaks and Valleys).

What is the Fibonacci tool that operates on the DOM?

No need for the Fibonacci "tool" on the DOM -- The DOM or ladder is just a facilitator of placing trades.
Is there a current platform that supports this?

"Is there a current platform that supports this?"

Most platforms provide a variety of Fibonacci "Tools". The one I use is ThinkOrSwim which is part of TD Ameritrade. Trade Station, Interactive Brokers, and many others provide for free with their free charting packages.
 
Last edited:
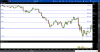
There is a right way and a wrong way to use fibs. As per the following ES 5 minute chart traders typically use point 1 top swing high (following overnight globex back and forth zone) and point 2 bottom swing low which gives them a 61.8% retracement above the actual lower swing high short opportunity. What I have learned is to look at price action to tell me which points to use. And instead use point A large thrusting red candle coming out of small consolidation zone, after first initial down wave, and point B (bottom of red candle) of double bottom. The reason I didn't use low of point 2 is that that candle's wick is just a few panicked traders having their stops run. Not important. I therefore almost always prioritize opens and closes over highs and lows. And BTW looking at the 1 minute would show the same but just be a more crowded screenpic. So I just stuck with the 5 min one in this post.View attachment 175346

SunTrader. Thanks for your chart and post. I do not require the information that you are using (but, of course, if it works for you -- great). You are using a more Subjective approach as to where you are starting and ending your retracements. I find it necessary to have Rules as to where to draw that are Objective, and not based on my opinion of reading the prior chart information to interpret what the meaning of bars; for example, "just a few panicked traders having their stops run". I believe that it also permits easy communications between traders, particularly those that are concerned about rules of drawing and the "science" requirement of being duplicable.
 
I also said ... I almost always use open and closes and breakouts out of congestion. Those points can be defined mechanically for those so inclined.
 
Thanks, SunTrader that makes good sense. And while. again I don't look for that condition but breakouts may be a great location. I appreciate your input.
 
Perhaps you are referring to the method by Al Brooks in his books and chatroom. I have a student that is a fan of Al Brooks and pays approximately $300 per month to be in his chatroom. The bottom line is that it Does Not Work. Perhaps you were not referring to that method of being able to anticipate the direction of the next bar or market trend by reading the charts (oftentimes tick charts) "bar by bar". Many so-called Trading Gurus profess that they can make market predictions by using Candlestick formations or patterns and others that base their system based on the position of what a bar that is higher than the 2 surrounding bars. That method has been sold under a number of different names. (Garbage In -- Garbage Out). Not sure what you wish to gain by "bar by bar" analysis.

No. That is in incorrect conclusion. I don't know much about Al Brooks. I have a couple of his books. They are densely and dryly written for me.

However, mahy people have found success with his methods. Many are in the ET archives.


The Fibonacci "Tools" are just Drawing tools, that are Free on most Charting Packages. You will have some idea as to anticipating "the next bar". It is possible that you would be able to predict the next 5 min bar if you are using a trading system which uses the fibs and a 5, 15 and 30 min charts. I can demonstrate that with lots of effort on this using multiple pictures or could prepare some video of my doing it live. So it does provide that look and anticipation of the "next bar". The question is how that is going to assist in trading profitably. Do you get in and out of a trade with 1 bar on a 5 min chart as a result of what the next bar is?

I trade on the 5min chart - equites. Holding times vary from multiple reversals per bar or holding for multiple bars in the trend segment. Depends on market conditions and timeframes of influence. Usually I trade the open. Currently making the transition to trading the ES, building my LTM of how it behaves.


Depends on why you want to know that? Really? Yes sometimes, you may neat to predict your targets or if using stops, where to locate your stops. If you are looking for an entry that will be determined by the fibs based on how long you anticipate being in the trade. Scalp for 10 minutes, Swing for 2 hours or even Position for Days. The Duration (which most traders disregard no matter what their method of trading) Is important. Generally only 2 points are needed. Number of Bars is not the determining factor it is picking Significant Highs and Lows (Peaks and Valleys).

We operate from different paradigms, thus yielding different understandings and results. I like to explore what other traders are thinking, where they think these thoughts and the emotional reactions and actions those thoughts cause. People interpret price action differently, not all opinions are equal. Discernment is the tool to decide which perspective offers better value.


No need for the Fibonacci "tool" on the DOM -- The DOM or ladder is just a facilitator of placing trades.

There is more to understand about what can be discerned from the DOM; only for Intrabar trading and carving turns during trend segment transitions.

The domain advanced experts, big dogs, the foolish, the arrogant, the revenge trader, the doubter, the inexperienced, the stupid, the less skilled, the more skilled, deep, shallow pockets whatever,... do their respective business receiving their expected unconscious results.

Comments within quoted text
 
Here is another chart pic (for the .... non-believers ....) of the Globex period from Thursday AM with a couple of more fibs in that zone but notice on bottom of chart lined up with swing low and top of chart lined up with lower swing high the numbers of bars between swings. 33 bars down from top, then 22 bars back up. Why do I mention that? 33 * 61.8% equals 20.4 so basically 22 bars with price and time pretty much 61.8% or "squared". Not exact but if you want exact buy a Swiss watch.
ES 61.8.png
 
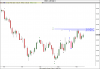
Suntrader, your chart is good though the explanation is a little confusing. One thing that might help is showing the points at which the drawings started. I will show you my version of the same chart (Thursday July 6) and I can tell you that my fibs were drawn using the overnight high/low of the Globex hours.
 

Attachments

  • reply to suntrader.png
    reply to suntrader.png
    43.4 KB · Views: 42
Last edited:
First your fib retracements are drawn upside down. Percentages should be ascending if drawn off high down to a low with market then moving back up. 38.2% (not the flip side 61.8%) should show near lower swing high point I've been referencing. Also note when you post an image down at the bottom there is a selection to attach image as a thumbnail or full image. Full image embeds it so reader doesn't have to have to go through trouble of clicking image to make it full size in a different screen.

As for my previous chart image I rushed it and you are correct I didn't make it clear where I was drawing my fibs from. Hopefully this new image makes it clear with the number and letter pairs. Also I noticed in changing different settings two of the fibs drawn wound up being by the defaults of high/low points by mistake.

This new chart image has all closes only and I since recognized another set that I missed previously (green 1, 2, 3) which tighten the zone further. To maybe show the points even clearer included is a second close only line chart.

HTH
ES 61.8 candles.png
ES 61.8 line.png
 

Attachments

  • ES 61.8 candles.png
    ES 61.8 candles.png
    30.5 KB · Views: 6
First your fib retracements are drawn upside down. Percentages should be ascending if drawn off high down to a low with market then moving back up. 38.2% (not the flip side 61.8%) should show near lower swing high point I've been referencing. Also note when you post an image down at the bottom there is a selection to attach image as a thumbnail or full image. Full image embeds it so reader doesn't have to have to go through trouble of clicking image to make it full size in a different screen.

As for my previous chart image I rushed it and you are correct I didn't make it clear where I was drawing my fibs from. Hopefully this new image makes it clear with the number and letter pairs. Also I noticed in changing different settings two of the fibs drawn wound up being by the defaults of high/low points by mistake.

This new chart image has all closes only and I since recognized another set that I missed previously (green 1, 2, 3) which tighten the zone further. To maybe show the points even clearer included is a second close only line chart.

HTH
View attachment 175433 View attachment 175436
I don't want to get into a stupid argument about "upside down". The chart speaks for itself: the support and resistance areas are clearly defined on my chart as they are on yours. And if clicking the icon is too much for your index finger I would suggest doing some exercises. I don't know what would help your brain.
 
Back
Top