I'm out of my league here-and also no experience here- but- regardless- foot in mouth- I will simply add some hindsight learning commentary- is easier for us all when we have a picture of what HAS already occurred !
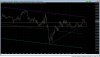
There are different ways of viewing charts- and even PA- Trending? sideways? Prevailing trend?
Ultimately, it's about gaining a small advantage in how the method benefits you. I prefer to take "With Trend" trades and try to hold on as long as the trend momentum keeps going- In your fast time frame - perhaps that might be 4-5 bars in a good trending period?
I cannot bring up NQ apparently on stockcharts- which is the charting site i use. If I could, i would try to add some ' training wheels' (no offense- I use them ) -or graphical representations of a slowed average of momentum.-of Just as a point of outside reference- and see if anything I say has any application- it can be useful (JUst my Opinion guys-Not a PA purist myself-never acquired the ability). I would clear my past chart of trend lines for starters, add a fast ema- play around with it- 3-4-5- and perhaps A slower ema may also coincide with the direction of the next higher time frame-say 20 or 30 ,50 As a small reaction in a fast time frame will be just a fart in the wind on a higher time frame. But it gives a sense whether price is trending on the higher time frame or is sideways. A follow up- I agree with TD as to having value aiding in the assessment.
A simple guide line graphic is price is trending as long as it is making higher highs and higher lows- many of your NQ bars are indecisive- a fast ema may be penetrated by a wick- but notice that a 'trend" can continue- more is important on the open and close and whether it holds above the trend line /ema-
EMA's are lagging indicators themselves- but they give a visual- idea- It seems the trend reversals are pretty sharp and fast on the minor trends- Once a bar fails to exceed a prior bar- get ready to swing around-.
A slower ema - also gives- a reference- if your best trades are taking With Trend and try to hold for 2-3-4 bars? or with limit sells higher in the order? My best trades are those I occasionally catch that i allow to run longer- If the trade is choppy, I tighten the stop closer- always try to keep a profitable trade a winning trade and not allow it to lose- Tough on the entry to do that though- got to give it some room.
As an exercise- try going back and determine- by the ema- if you were taking trades with the new trend or were getting in wrong- just a suggestion- change the emas-or smas and see if that would have changed your decisions to enter- or to sell and get the larger gain-
Another -"different"way of viewing what is really occurring in the major way is using RENKO bars- They are interesting
Because of the wide bar volatility- you would choose the HI-LO setting vs the Close setting- and a 1 minute bar period for the higher 5 minute time frame-
http://stockcharts.com/school/doku.php?id=chart_school:chart_analysis:renko-
Hmm -'lost' some of this stuff when I posted-"too many characters"-maybe it showed up as a partial post-
Out of time- quit rambling -summarize-
Your longer term trendline really had some nice pullbacks to it -5 of 6 -If you find these trend lines are valid, a buy-stop order waiting as price moves back to the trend line would give a nice early-low risk entry.
Tried to be constructive & objective- a different perspective of viewing the same chart may be instructional-
Sorry if repetitive- SD
Try the Symbol QQQ should be the Nasdaq 100 or $NDX.
It's a hard future to trade, doesn't run on enough for my likings very stop and start aswell, momentum doesn't work well at all.
")