FB earnings strangle

This is why out of sample testing and actual trading are useful.
This is why curated non-obvious data sets are important.
This is how edge is developed and determined.

What makes the data curated non-obvious?
  • Earnings move estimates use residual straddle valuations based on distributions developed with years of actual earnings moves and IV crush related data.
  • Ex earnings IV modelling utilizes term structure shapes developed from years of data.
  • Forecasted theoretical values utilzes forecasts of HV, long-term cross sectional IV analysis, slope and derivative short and long term forecasts, and earnings moves.
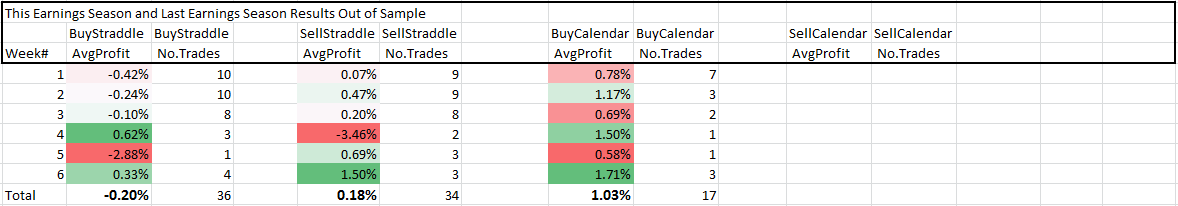
My working theory is that the calendar performs better because it takes advantage of the (curated non-obvious) data better than the other strategies tested. The calendar benefits from estimates of earnings moves, where IV will fall after earnings, good HV calculations, term skew modelling, and theoretical values to identify the trades.

Testing with superior data is the way to verify, tweak, and ultimately develop a successful trading strategy.

How is this not overfitting
 
It could be over fit. If a test is over fit it will likely not perform out of sample.
What is important is being predictive.
Fitting historical data with a small set of relevant data and testing out of sample can work.
It is important to watch for the out of sample tracking the in sample.
Here are the results of yesterday's signals with exits and below that are today's signals. The program runs starting at 11 am EST.
UPS was the sole loser out of the seven.

0cdfdae9b0a2c1a8281b29ddfe52f32f.png


Again, this is a new test and I'll be tracking these and trading some to get a feel for what slippage assumptions should be added. These are fairly liquid names this early in earnings season and I'm experiencing about $0.10 of mid market slippage or about 0.10%.

This is the updated out of sample test:
b7443754c6b5941d676fbf7f2b3b7183.png


With the small net loss in the SellStraddle the average is down small to 0.18% from 0.19%.
The Buy Calendar is up to 1.03% from 0.97% posted earlier in this thread because of the good day today.
 
I will put today's results here. If anyone wants to see more, you can ping me.
There were three winners and one loser from yesterday, GRMN.
Today there are some long straddles, short straddles, and long calendars.
ef47f24fa4f8df478063945afbd8fb82.png
 
If you actually "want" shares, then you buy them - or maybe just get a quick discount by selling ATM. Trying to get shares by selling puts is like waiting for your neighbor to get into an accident so you can buy his car cheaply.
Well said.....
 
Yes. But not to buy a stock cheaply. If I get assigned it means I was wrong.
Absolutely, I explicitly stated that I didn’t want to take assignment (hence 17 delta) but if I had to, the 300 spot was an acceptable spot given how much bad news was already priced in. Could it have dropped to 250, of course, this is trading, not creative writing.
 
Absolutely, I explicitly stated that I didn’t want to take assignment (hence 17 delta) but if I had to, the 300 spot was an acceptable spot given how much bad news was already priced in. Could it have dropped to 250, of course, this is trading, not creative writing.

the second part of your thesis is an investment fallacy. If the stock falls to 300 it’s because something has happened. Sure if the news today was all that there was, then maybe 300 is a cheap price. But if it goes to 300, it’s likely that there is more news that’s negative (like maybe criminal investigation or fcc regulation).
 
Back
Top