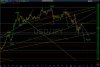
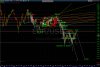
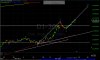
USD/JPY continued rebound to 121.69, thenUSD/JPY's another wave, 3]5)5, was a wave-5-failure and
ended at 125.282 instead of going up to 127.5.
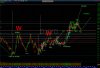
Wave 4]'s now at 116, a little bit lower than 118, may go down to 114.
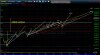
Wave I5] may go UP to 149.
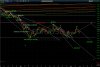
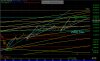
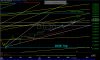
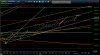
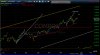
fell pass 114 to 110.97.
This may be Wave 4]c)3.
Wave 4]c)4 may go UP to 116.
Wave 4]c)5 may go DOWN to 108, 106 or 110.