Ewj: elliott wave

That's the way it is.
UP then DOWN as expected.
 

Attachments

  • INDU20180222.jpg
    INDU20180222.jpg
    184.3 KB · Views: 29
INDU overshot 25750 target to 25800.
If INDU goes up to 26400, it may be Wave IIa]1)1.c .
If INDU goes down to 24800, it may be Wave I5]5)3 .
 

Attachments

  • INDU20180228.jpg
    INDU20180228.jpg
    252.6 KB · Views: 20
INDU went DOWN to 24876, very close to 24800 target, so it may be Wave I5]5)2.
Next may be another 5 waves UP to 27500 as Wave I5]5)3.
Wave I5]5)2 might take some more time though.
 

Attachments

  • INDU20180301.jpg
    INDU20180301.jpg
    225.3 KB · Views: 11
Wave I5]5)2, theoretically, can retrace almost all of Wave I5]5)1.
An ugly alternative count is irregular Wave IIa]1)2.
Wave IIa]1)3 can go DOWN to 23100.
 

Attachments

  • INDU20180302.jpg
    INDU20180302.jpg
    208.1 KB · Views: 16
Failed "Big M" caused a lot of money for a lot of people selling from 2000 HIGH. NASDAQ composite rose from 4350 to 6908 in 2 years instead of falling to 1150. A 59% rise!
Compqx may be in Wave I5]3)5.5:3. Wave :5 might have ended or may end just below 7100.
Wave I5]5) might end at 8600-9500 as said 2 years ago.
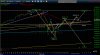
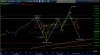
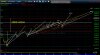
Looks like Compqx is going to 8600-9500 as said 2 years ago.
 

Attachments

  • NASDAQ20180310.jpg
    NASDAQ20180310.jpg
    193.5 KB · Views: 17
  • 20171215weekly.jpg
    20171215weekly.jpg
    254.1 KB · Views: 15
Divergence between NASDAQ and most other indices.
NASDAQ should be in Wave B of an irregular correction.
 

Attachments

  • INDU20180316.jpg
    INDU20180316.jpg
    230.8 KB · Views: 14
  • NASDAQ20180316.jpg
    NASDAQ20180316.jpg
    196.1 KB · Views: 13
I don't suppose anyone has tracked mu200411 performance based on what he said on this thread and has results? Its a looooong thread, so maybe, against all odds, they are good!
 
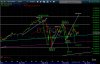
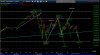
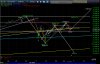
NASDAQ Wave IIc] followed Wave IIb] as expected. Wave II may be an Irregular Correction or a Running Correction.
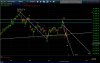
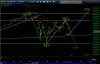
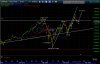
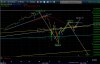
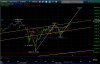
INDU Wave II can be a Triangle if there is no new low.
INDU Wave IIa]1)3.4 may rebound from 23,100 - 23,000 and look like a trap.
 

Attachments

  • NASDAQ20180323.jpg
    NASDAQ20180323.jpg
    205.6 KB · Views: 10
  • INDU20180323.jpg
    INDU20180323.jpg
    230.8 KB · Views: 9
Back
Top