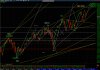
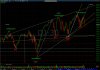
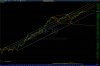
NASDAQ broke last supporting trend-line. The "Big M" pattern is tentative.NASDAQ
Measured moved target 5,200.
2000 High target 5,132.52
Triangle Thrust target 5,050.
5042.14 might have been the TOP near 5050 target.
NASDAQ broke last supporting trend-line. The "Big M" pattern is tentative.NASDAQ
Measured moved target 5,200.
2000 High target 5,132.52
Triangle Thrust target 5,050.
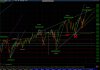
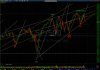
INDU didn't follow NASDAQ UP to new high but followed DOWN.Will INDU follow NASDAQ to 18,700 or 18,900?
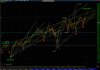
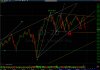
SPX didn't follow NASDAQ UP to new high. Will it follow DOWN?Will SPX follow NASDAQ to 2,150 or 2,180?
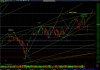
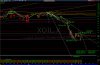
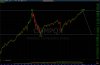
NASDAQ's "Big M" confirmed, targets may be 4,719 or 4,684 or 4,580.NASDAQ broke last supporting trend-line. The "Big M" pattern is tentative.
5042.14 might have been the TOP near 5050 target.
Intraday INDU's "Big M" confirmation and breakdown of Ending Diagonal support.INDU didn't follow NASDAQ UP to new high but followed DOWN.
The "Big M" pattern is tentative too.
SPX's "Big M" is now tentative.SPX didn't follow NASDAQ UP to new high. Will it follow DOWN?
SPX's two "Big M"s patterns are waiting to be tentatively confirmed.
TRAN rebounded from near "Big M" target at 8,584.TRAN breakdown confirms the last "Big M" pattern.
The tentative previous "Big M" may be confirmed soon.
Note: Quintuple Tops.
Better late than never. Crude Oil went up to $52.48 the fell.Crude Oil didn't go up as expected but fell to $44.75 near previous low.
If this is a Flat Correction, Crude Oil may return to $54.24 as Wave 3)4.c .
Wave V]IV)C3]5) can go DOWN to $37 or $31.
Six months without significant move!Intraday INDU's "Big M" confirmation and breakdown of Ending Diagonal support.
Target may be 17,100 - 17,000.
NASDAQ's Wave IV)C may be unfolding.NASDAQ's "Big M" confirmed, targets may be 4,719 or 4,684 or 4,580.
BULL Trap support at 4,810. Another support at 4,610.