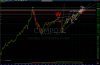
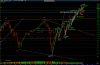
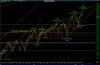
NASDAQ is under the influence of a large "W" pattern since the year 2000 which is almost complete.
This may be Cycle A-B part of a 16-year Flat Correction of Super-cycle Degree Wave IV).
Robert Prechter counted 1966-1982 as a 16-year complex correction.
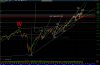
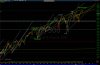
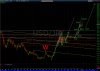
Intermediate Wave5) may be an Ascending Triangle or Ending Diagonal.
This may be Cycle A-B part of a 16-year Flat Correction of Super-cycle Degree Wave IV).
Robert Prechter counted 1966-1982 as a 16-year complex correction.
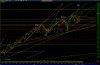
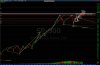
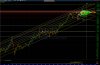
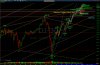
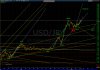
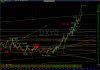
Intermediate Wave5) may be an Ascending Triangle or Ending Diagonal.