You are using an out of date browser. It may not display this or other websites correctly.
You should upgrade or use an alternative browser.
You should upgrade or use an alternative browser.
Ewj: elliott wave
- Thread starter mu200411
- Start date
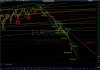
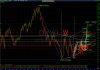
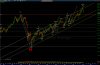
EUR/USD 1.130 taken out so swiftly!After EUR/USD rebounded to 1.18710 as Wave III3]3)4,
Wave III3]3)5 went DOWN as expected to 1.15702 near 1.152 target.
EUR/USD can go DOWN to 1.130 with or without a rebound to 1.187 first.
This may be the end of Wave 3)3 or Wave 3)5.
Next may be a rebound of Wave 3)4 to Wave 3)3.4,
or Wave 4) to Wave 3)4
Attachments
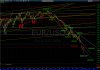
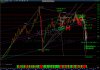
Crude Oil stays above long term support.There was Crude Oil's wave v DOWN as expected,
which fell pass $45.9 to new measured moves at $44.20, then rebounded to wave iv.
If this is Wave 3)5.4, Wave 3)5.5 may fall from near $49.65 to $28.30.
If this is Wave 4) Wave 5) may fall from near $59 to Fri 1/23/09 low at $32.70.
If this is Wave 4] there may be a 3-year sideway market again.
Note: The 6-year old beautiful Head and Shoulders pattern.
If this is Wave 3)5.4 the target may be $60.
If this is Wave V]IV)C4] the target may be $77.
Attachments
![0205Crude_4)or4].jpg](/et/data/attachments/132/132081-f3817f7acd19693e972e3b84861f9d35.jpg?hash=84F_es0ZaT)
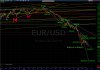
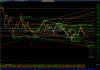
EUR/USD rebounded from 1.109 to 1.153 may be Wave III3]3)4 or Wave III3]4).EUR/USD 1.130 taken out so swiftly!
This may be the end of Wave 3)3 or Wave 3)5.
Next may be a rebound of Wave 3)4 to Wave 3)3.4,
or Wave 4) to Wave 3)4
Wave III3]3)5 may go DOWN to 1.097 after a rebound to 1.124.
Wave III3]5) can go DOWN to 1.020.
Attachments
The wave passed the 94 target to end at 95.48 .$USD (92.53) reached 2005 High at 92.63 .
There is still another wave UP to go may be to 92.9 or 94.
The set back to 93.25 is small, may be count as Wave 5)4.
Wave 3]5)5 can go UP to 99 or 102.
$USD is currently under the influence of 14-year "W" pattern.
"W" pattern target may be 108 and 113.
Note: 95.48 is near 50% Fibonacci Retracement.
: 102 is near 61.8% Fibonacci Retracement.
Attachments
Gold rose to $1307.80 then fell.Gold Wave IVc]5)3.4 rose UP to $1,282.40 invading Wave IVc]5)3.1 at $1,277.40.
If "Wave IVc]5)3.5 to $1,080 targets" didn't materialize,
we may have to change our count.
This may be Wave IVc]5)3.4 or complex corrective wave IVc]4).
Wave IVc]5)3.5 can go DOWN to $1080.
Wave IVc]5) can go DOWN to $960.
Attachments
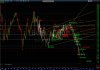
Silver Wave IVc]5)5.4 rebounded as high as $18.5 but was still below Wave IVc]5)5.1 then fell again.Silver fell as 5-wave to $15.56, may be Wave :1,
then rebounded as 3-wave to $16.48, may be Wave :2,
then fell to lower low at $15.51, may be Wave :3,
of which target may be $14.75.
Wave :5 target may be $13.9.
If there are extensions Wave IVc]5)5.5:5 target may be $12.9 or $11.25.
Wave IVc]5)5.5 target may be $13.7 or $12.1 .
Attachments
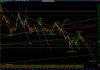
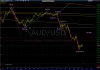
AUD/USD didn't rebounded as expected.AUD/USD 0.80660 target passed (low = 0.80352) .
Next may be a rebound to 0.860.
Wave IIc]5)3.5 extended to as low as 0.762 which is at a measured move.
Wave IIc]5)3.5 might have ended.
Wave IIc]5)4 could go UP to .83 or .86 .
Attachments
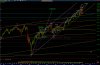
UTIL Triple Zigzag V]IV)B might have ended at 657.17 so a 13.6% fall to 567.55.
The rise from 2009 to 2014 can be counted as 5 waves though wave 3 is somewhat atypical.
Correct of this 5 waves may end near wave 4 at 467.93 or a 27.27% correction.
Supports are at 555.71 and 524.82.
The rise from 2009 to 2014 can be counted as 5 waves though wave 3 is somewhat atypical.
Correct of this 5 waves may end near wave 4 at 467.93 or a 27.27% correction.
Supports are at 555.71 and 524.82.
Attachments
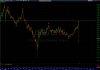
TRAN Wave 5) or Wave 5)1 might have ended at 261.8% Fibonacci advancement or a large measured move.
Wait to see the development of the "Big M" pattern.
An alternative count is the green count with TRAN a bit longer than measured move.
Another alternative count is the pink count with TRAN a bit shorter than measured move.
Wait to see the development of the "Big M" pattern.
An alternative count is the green count with TRAN a bit longer than measured move.
Another alternative count is the pink count with TRAN a bit shorter than measured move.