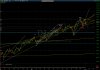
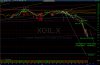
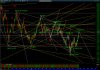
INDU measured move UP target versus Ending Diagonal.If INDU falls below the last trendline, it may confirm a "Big M" pattern and a b-wave.
Note: Many previous irregular corrections.
Attachments
Last edited:
INDU measured move UP target versus Ending Diagonal.If INDU falls below the last trendline, it may confirm a "Big M" pattern and a b-wave.
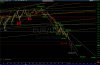
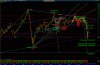
TRAN measured move UP target versus Zigzag DOWN target.If TRAN falls below the last trendline, it may confirm a "Big M" pattern and a b-wave.
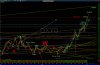
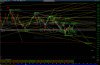
NASDAQ measured move UP target versus Ending Diagonal.If NASDAQ falls below the last trendline, it may confirm a "Big M" pattern and a b-wave.
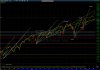
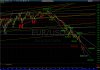
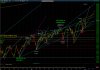
SPX measured move UP target versus Ending Diagonal.If SPX falls below the last trendline, it may confirm a "Big M" pattern and a b-wave.
$USD (92.53) reached 2005 High at 92.63 .$USD 91.81 near 92.0 target and 2005 High at 92.63.
There may be one more wave UP before some set back.
It turned out Wave III3]3)3 was extended.EUR/USD (1.18684) went below 2010 low (1.18758).
May be Wave III3]3)3.
After a rebound as Wave III3]3)4, Wave III3]3)5 can go DOWN to 1.152.
There was Crude Oil's wave v DOWN as expected,Crude Oil fell as expected to lower low at $52.03, may be wave i, ii and iii.
The rebound to $55.11 may be wave iv.
There may be wave v DOWN to $49.3, $48.5 or $45.9.
This may be Wave V]IV)C3]3)5 or V]IV)C3]5).
Wave V]IV)C5] target may be $32.7.
Gold rose to higher high at $1244.60, this can be Wave IVc]5)3.4 until $1255.60Gold fell as 5-wave to $1,170.70 then rebounded as 3-wave to $1,210.90.
May be Wave :1 and :2.
Gold fell again to lower low at $1,167.30, may be Wave :3.
Wave :3 target may be $1,145.
Wave :5 target may be $1,108.
After EUR/USD rebounded to 1.18710 as Wave III3]3)4,EUR/USD (1.18684) went below 2010 low (1.18758).
May be Wave III3]3)3.
After a rebound as Wave III3]3)4, Wave III3]3)5 can go DOWN to 1.152.
Gold Wave IVc]5)3.4 rose UP to $1,282.40 invading Wave IVc]5)3.1 at $1,277.40.Gold rose to higher high at $1244.60, this can be Wave IVc]5)3.4 until $1255.60
which is Wave IVc]5)3.3:4 high.
Wave IVc]5)3.5 target may be $1,113 or $1,050.