You are one ignorant motherfucker.
Sea Surface Temperature
These sea surface temperature maps are based on observations by the MODIS sensors on NASA's Terra and Aqua satellites. The satellites measure the temperature of the top millimeter of the ocean surface. In this map, the coolest waters appear in blue (approximately -2 degrees Celsius), and the warmest temperatures appear in pink-yellow (35 degrees Celsius). Landmasses and the large area of sea ice around Antarctica appear in shades of gray, indicating no data were collected.
Land Surface Temperature
Land surface temperature is a measurement of how hot the land is to the touch. It differs from air temperature (the temperature given in weather reports) because land heats and cools more quickly than air. This image depicts average monthly land surface temperature in degrees Celsius as measured by the Moderate Resolution Imaging Spectroradiometer (MODIS) on NASA’s Terra satellite. The warmest temperatures are pale yellow, while the coldest temperatures are dark blue. Moderate temperatures are depicted in shades of pink and purple. Regions where land surface temperature measurements were not possible are gray.
http://earthobservatory.nasa.gov/GlobalMaps/view.php?d1=MYD28M&d2=MOD11C1_M_LSTDA
"NOAA claimed record heat in numerous locations is September, like these ones in Africa and the Middle East."
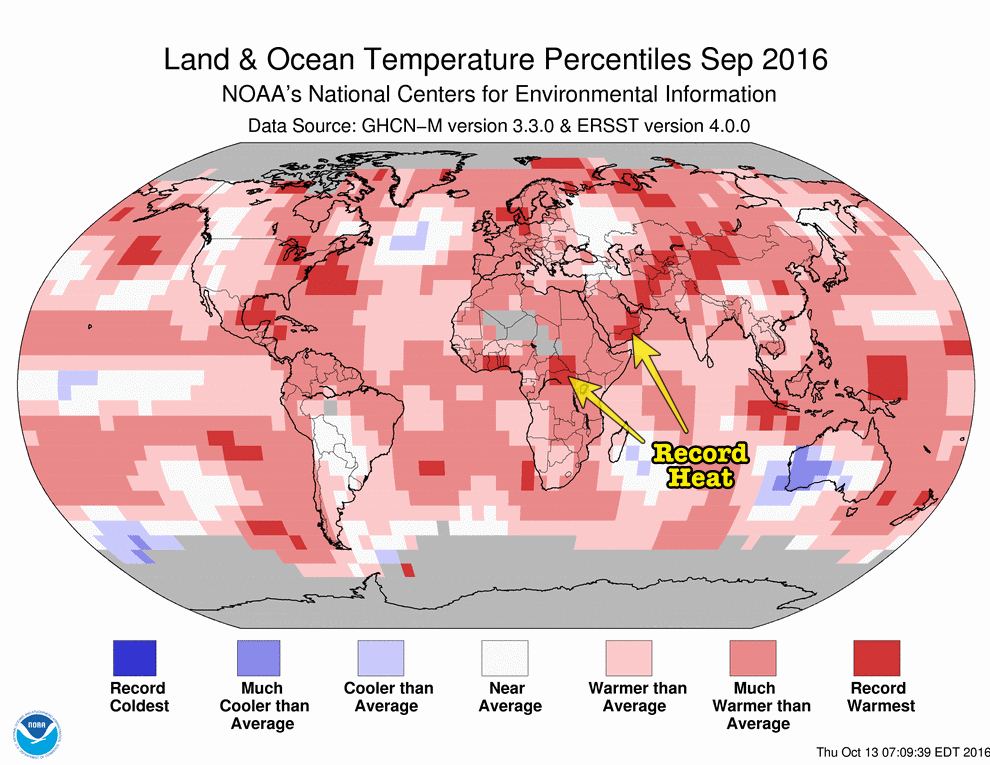
"This is a remarkable feat, given that they don’t have any actual thermometers in those regions. In fact, NOAA doesn’t have any thermometers on about half of the land surface."
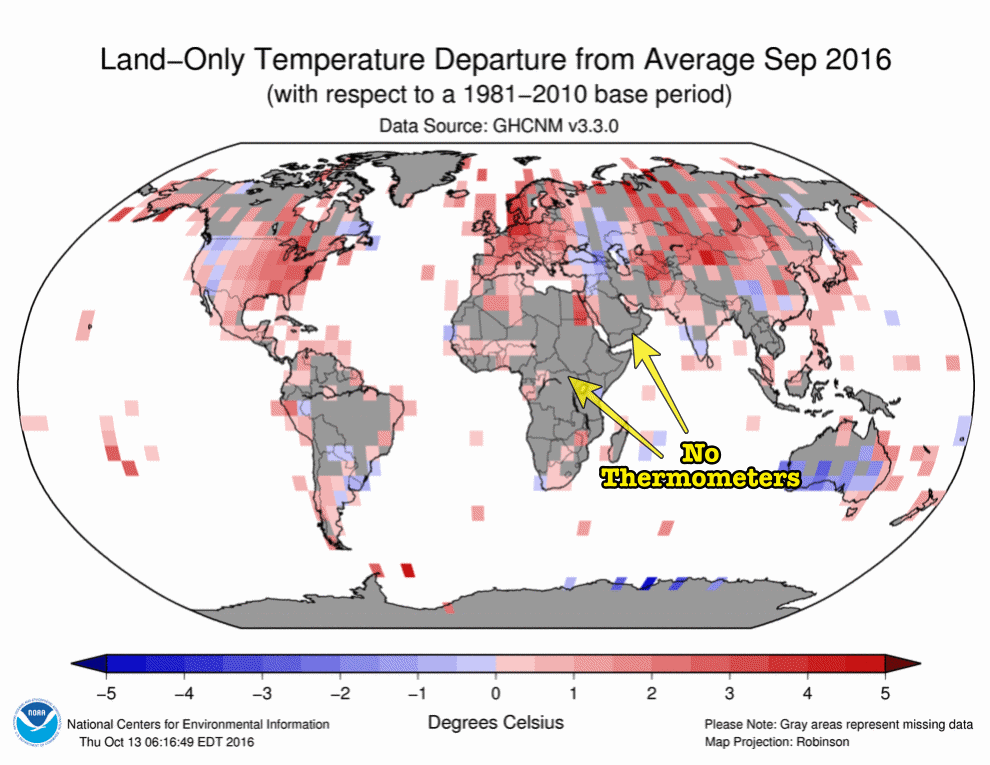
"Satellite temperatures showed that September was close to normal in those regions which NOAA declared to be record hot."
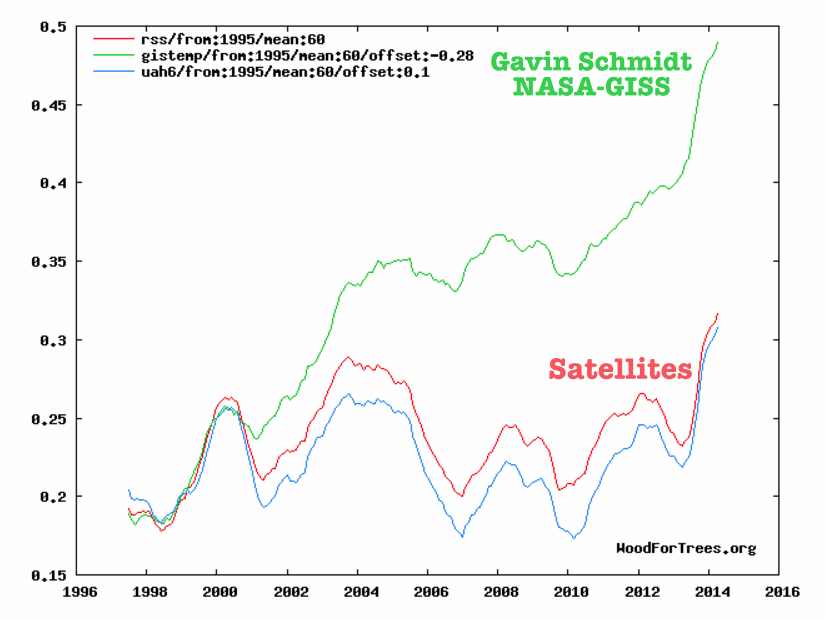
"The global surface temperature record is garbage. This is the 21st century, and it needs to be replaced by satellite temperatures which show little or no warming this century."
Dear God, please have President Trump end this fraud. In Jesus name, amen.