ES Journal - 2021/2022

This is too funny.
I wanted to revisit 2 weeks after the last post regarding this.

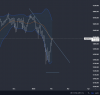
This time I included the percent scales on both charts.
Check it out---- on the left side.
Pretty damn close.

These both go from 11/30 to 2/1 of their respective years.
I don't necessarily think it'll prognosticate February 2022, but so far, for the last 2 months at least, history would appear to be repeating lol.

View attachment 277076

So....

Here's the picture of QQQ from Jan 1 thru St. Patty's Day of 2016.
Who knows if the pattern will continue or not.
It'd be funny if it did though.
Beats me.

View attachment 277077


Yeah good post. It does make logical sense too though, each chart basically has an area where strong deep buys typically generate from (basically after chart falls "x" amount, it's in prime position for turn around).

This pattern on the Daily, is the same pattern that plays out on smaller charts essentially everyday.
Remember, it's the Q's though. Not the S&P.
I mean market patterns tend to repeat, but for real, I think it's just a coincidence lol.
I can't remember that far back... what was going on at the time?
That's why I picked St Patty's Day on the forward chart.
Seemed appropriate. :rolleyes:
 
Remember, it's the Q's though. Not the S&P.
I mean market patterns tend to repeat, but for real, I think it's just a coincidence lol.
I can't remember that far back... what was going on at the time?
That's why I picked St Patty's Day on the forward chart.
Seemed appropriate. :rolleyes:


I went back and checked it this move has better velocity / stronger momentum already than the 2016 one. It took until 02/17/2016 for us to have similar momentum than we currently have on the NQ as of this Daily bar (and that was right before we started the up move to similar resistance levels that we may be hitting soon on NQ)

So, this move has reasonable probability to continue higher, at least to the levels I posted earlier ES 4581 ish and NQ 15487 ish.
 
I borrowed some lines from here and I think (so by definition this scenario will not play out) we get a retracement from around A - or where we are now. Area B could possible be a point for a leg up again if we do not continue further down. If we go down area C could be a first 'target'.

(When I draw these lines on previous 'corrections' in almost every case price just went further up)
ab1234.PNG


NQ:
nq123.PNG
 

Attachments

  • nq123.PNG
    nq123.PNG
    45.7 KB · Views: 1
Last edited:
I'm experimenting a bit with volume profile. Yesterday's late session move and continuation in ETH left behind a pocket.

I still think the long side is the right side from here, but the R/R is not favourable from here. I think I'll be buying if we can go down to the 4520 area and we find some support there. Right now we're at resistance and would have a large gap up on the Open which will likely have some back-filling on the Open.

upload_2022-2-2_9-45-17.png
 
And up we go...

The bulls and Powell doesn't know or care what resistance/volume pockets is... :)

I have an open gap above at 4654 which is my target by end of week if we get continuation higher. Nothing to do now, though, but wait for an opportunity.

upload_2022-2-2_10-51-32.png
 
Last edited:
And even if it rises further, and IF it goes down ultimately, I see all kind of levels for possible inflection points (basically everywhere up). And I even left all ema's / fib levels out. So we can always look back later and see our 'chart' explanation (just like our 'news' explanation) :)

But I wonder, if even rate hikes can't get NQ down, what will?
Cest nest pas une pipe.PNG
 
Stoppped out for a tick on that one. Back in short @ 68 with a 5 point stop. Playing the retrace in this zone and potential reversal.

EDIT: Took the stop. Flat and waiting.
 
Last edited:
I still like the probability of NQ retesting the 15605-15987 area. That's what often happens after we get a buy signal, which I got two on ES Daily 01/27/2022 and one on NQ 01/28/2022.

So, far market is acting a lot more normal now. Buy signal, than trade above my Daily EMA's now candle closing above them. Feel pretty good about there being some upside left. At least to ES 4580 ish and NQ 15485 ish, even if we don't make it fully back to NQ distribution zone (or scene of the crime, however you want to describe it).


Haha ES 4580 on the tick, like clockwork. Almost is if this stuff is pre-programmed.
 
Back
Top